Curated OER
Measuring Soil Temperatures at South Penquite Farm
Students investigate soil temperatures. In this graphing and earth science lesson, students insert temperature probes into different types of soil at varying depths. Students complete a data chart and construct a related graph...
Curated OER
Frequency, Histograms, Bar Graphs and Tables
In this frequency instructional activity, students interpret histograms, bar graphs and tables. They examine frequency charts and comparison line graphs. This three-page instructional activity contains 4 problems. Answers are provided...
Curated OER
Integrated Algebra Practice: Frequency Histograms, Bar Graphs and Tables
In this graphs learning exercise, students solve 4 problems about histograms, bar graphs, and tables. Students answer questions about histograms, bar graphs, and tables.
Curated OER
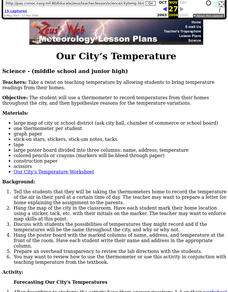
Our City's Temperature
Students use a thermometer to record temperatures from their homes throughout the city, and then hypothesize reasons for the temperature variations. They use a weather graph worksheet that's imbedded in this lesson to orgainize their data.
Curated OER
Ocean Currents and Sea Surface Temperature
Students use satellite data to explore sea surface temperature. They explore the relationship between the rotation of the Earth, the path of ocean current and air pressure centers. After studying maps of sea surface temperature and ocean...
Curated OER
Using Vegetation, Precipitation, and Surface Temperature to Study Climate Zones
Students begin their examination of the climate zones found around the world. Using a software program, they identify the relationship between the vegetation, climate and temperatures of the different zones. They also plot coordinates...
Curated OER
Graphing the Forecast-Line Graph or Bar Graph?
Students explore bar and line graphs. In this data collection, graphing, and weather instructional activity, students compare bar and line graphs and discuss which type of graph would be most appropriate for displaying a ten day weather...
Curated OER
Interpreting Line Graphs
Fifth graders interpret line graphs. In this graphing instructional activity, 5th graders first begin by reviewing the difference in bar and line graphs and what they are used for. Students practice interpreting the data on various line...
Curated OER
Data Analysis, Probability, and Discrete Math: Line Graphs
Eighth graders analyze data from line graphs. They discuss the purpose of line graphs, identify the parts of a line graph, answer questions about various graphs, and complete a worksheet. This instructional activity includes a script...
Curated OER
Math Regents Exam Questions: Graphing Rational Functions
In this graphing rational functions worksheet, students answer 18 multiple choice problems about rational functions. Students determine values for a which a function is undefined given the equation of the function.
Curated OER
Statistics for Graphing
Students use the Internet to access a variety of websites that present statistics and information for use in graphing. They represent sports statistics, geographical measurements, temperatures and more.
Curated OER
Graphing Ordered Pairs
Here is graphing worksheet which has pupils graph ordered pairs and label the axis. They graph five ordered pairs and then interpret the data in the graph.
Curated OER
Water Chestnut Graphing Activity
Students are taught how to format and enter data into an Excel spreadsheet. They make a graph and interpret graphed data. Students discuss possible impacts of water chestnut invasion. They graph data on water chestnut. Students report...
Polar Trec
Temperature Profile above the South Pole
Collecting and understanding data is a big part of understanding the world and how it changes. To better grasp what temperatures are changing and how they affect global populations, learners create a graph based on the date provided....
Curated OER
A Day at the Beach
Help learners determine the rate of change for the temperature of sand. They will collect data on the temperature of wet and dry sand over time with a heat lamp overhead. Then make a scatter plot of the data and find a linear model to...
Curated OER
Creating Climographs
Students use satellite data to compare precipitation and surface temperatures on different islands. In this satellite lesson students create graphs and explain the differences between weather and climate.
Curated OER
How Does Water Cool?
How fast does water cool? First fifth graders will draw a line on a graph that predicts how fast they think water can cool from boiling. Then they plot the actual data on the same graph to see if their estimate was correct.
Curated OER
Is Grandpa Right, Were Winters Colder When He Was a Boy?
Young scholars compare current weather data to historic data to see if there is a temperature change. In this weather instructional activity students complete a lab activity and determine average changes in temperature, precipitation...
Curated OER
Red Worms Rock!
Second graders measure red worms. In this lesson, 2nd graders observe and collect data on red worms. Students measure the red worms and create a graph with the data they collect.
Curated OER
Busted Bubbles
Using the scientific method, and bubble gum, learners conduct a motivating experiment. After conducting a series of tests involving bubble gum, they graph and analyze their results. This is the type of activity everyone loves.
Curated OER
The Fabled Maine Winter
Students graph and analyze scientific data. In this research instructional activity students use the Internet to obtain data then draw conclusions about what they found.
Curated OER
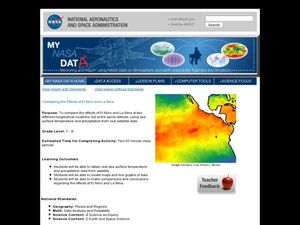
Comparing the Effects of El Nino and La Nina
Students examine the differences between an El Nino and La Nina year. In this investigative lesson students create maps and graphs of the data they obtained.
Curated OER
Level III: Technology Integration
Fourth graders prepare two spreadsheets each with an embedded line graph that displays data about the growth of the bitter rot fungus on apples and on petri dishes that were stored in the refrigerator and the classroom. They prepare a...
Curated OER
Experimenting with Pressure and Volume
Students explore the relationship between temperature and pressure using a paper-pencil laboratory activity and software. The nature and behavior or gases with respect to temperature is the focus of this lesson.


