Curated OER
Moo-Velous Butter!
Third graders investigate how temperature and motion (energy) create a chemical change that turns cream ( a liquid) into butter (a solid). They create a class pictograph of their favorite mils choices (white, chocolate, or strawberry)...
Chicago Botanic Garden
Historical Climate Cycles
Ice core samples give scientists access to climates of old—those from more than 800,000 years ago. Through an analysis of various temperature graphs from ice cores, tree rings, and weather stations, scholars compare historical climates...
Curated OER
Feeling the Heat
Pupils record temperatures at different locations around campus. They examine the results and draw conclusions about how materials and colors affect the amount of heat produced. They also analyze Los Angeles' temperature records over a...
Curated OER
Rates of Chemical Reactions-The Iodine Clock Reaction
High schoolers investigate the reaction rate of iodine and soluble starch. In this rates of chemical reactions lesson plan, students study the effects of varying concentrations of reactants and varying temperatures of reactants on the...
Curated OER
My Angle on Cooling
Students explore how the angle and distance of an object can change it's temperature. After reviewing how the position of the Earth affects the temperature of the planet, student groups design and perform an experiment to test how...
Curated OER
Radiation Comparison Before and After 9-11
Using the NASA website, class members try to determine if changes could be detected in cloud cover, temperature, and/or radiation measurements due to the lack of contrails that resulted from the halt in air traffic after the attacks of...
Curated OER
Gasoline Additive
Chemists consider a situation in which an ethanol producer needs to determine how much to add to t-butanol to prevent freezing during transport. They work in the laboratory to obtain the freezing point depression constant for the...
Curated OER
Measuring Temperature and the Production of CO2 in Yeast
Students use a model experiment to complete an experiment on yeast. In groups, they identify the independent and dependent variables and use the scientific method to complete the activity. They record their observations and discuss them...
Curated OER
Trends of Snow Cover and Temperature in Alaska
Students gather historical snow cover and temperature data from the MY NASA DATA Web site. They compare this data to data gathered using ground measurements from the ALISON Web site for Shageluk Lake. They graph both sets of data and...
Curated OER
Daily Weather Calendar
Young learners will love this fun weather activity that incorporates math, science and writing. Each member of your class gets a turn becoming a meteorologist! At the end of recess, the two chosen meteorologists met the teacher at a...
Curated OER
Graphing Exercise of Ideal Gas Data
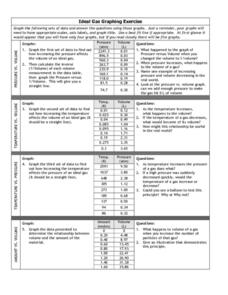
In this graphing of Ideal Gas Data worksheet, learners use the given data to draw 4 graphs of the given data. They are given the pressure and volume to draw and interpret the graphs.
Curated OER
Graphing Temperatures
Learners identify current temperatures for different regions of the United States. Using current information, they develop hypothesis for the temperature in the same region tomorrow. They use the Weather Channel website to find actual...
Curated OER
Temperature
In this temperature worksheet, students color a thermometer to depict the given temperature. They then compare, contrast temperatures and answer given thinking questions. There are approximately 20 questions on this one-page worksheet....
Curated OER
Temperature and Pressure
Students conduct an experiment to determine the relationship between pressure and temperature. In this physical science lesson, students collect data and graph them. They compare the results of Celsius and Fahrenheit data sheets.
Curated OER
Weather Graph
For this graphing worksheet, students read the average monthly maximum and minimum temperatures in Paris and use them to complete a color coded line graph. Students graph 24 figures.
Curated OER
Plotting Temperature and Altitude
students convert the temperature readings from degrees Celsius to degrees Fahrenheit. they predict and create a graph of what the graph of altitude (x-axis) versus temperature in degrees Fahrenheit (y-axis) might look like.
Curated OER
Using Excel to Reference and Graph Live Data from a Web Site
Students collect live buoy data about water temperatures in the Gulf of Mexico from the Internet and work individually to organize their data and create a line graph using Excel Spreadsheet. Students analyze their data and examine any...
Curated OER
Hypothermia: Temperature Changes Under Varying Conditions
Students conduct an experiment to determine what type of clothing would be most suitable for outdoor activities. They determine the temperature changes of the skin under various wet clothing materials and graph the temperature changes. ...
Curated OER
Biomes Summary-Temperature, Precipitation, and Location
Students examine the weather conditions of the various biomes on a world map. In this geographical weather lesson, students identify the seven biomes and color each biome a specific color. Students view a list of the average temperature...
Curated OER
Making Circle Graphs
In this circle graphing learning exercise, 6th graders answer ten multiple choice questions based on their knowledge of circle graphs. This is an interactive learning exercise.
Curated OER
Frequency, Histograms, Bar Graphs
In this statistics worksheet, students plot and graph their data, then interpret the data using the correct form of graphs. There are 3 detailed questions with an answer key.
Chicago Botanic Garden
Historical Climate Cycles
Scientists use ice core samples to obtain temperatures of the earth from 400,000 years ago! The third of five lessons instructs pupils to interpret historical climate data to see changes over time. In part I, participants interpret...
Chicago Botanic Garden
Climate Change Around the World
Look at climate change around the world using graphical representations and a hands-on learning simulation specified to particular cities around the world. Using an interactive website, young scientists follow the provided directions to...
NOAA
Climographs
In the second lesson of a five-part series, young climatologists use provided temperature and precipitation data to create climographs of three different cities. They then analyze these climographs to develop a general understanding of...


