PBS
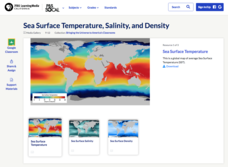
Sea Surface Temperature, Salinity, and Density
Earth's vast ocean is full of mysteries! Science scholars discover the big-picture properties that influence its characteristics at different latitudes using a lesson from PBS's Weather and Climate series. After completing a background...
Curated OER
Differences Between Ground and Air Temperatures
Students examine the differences between air temperature and ground temperature. For this investigative lesson students find NASA data on the Internet and use it to create a graph.
Curated OER
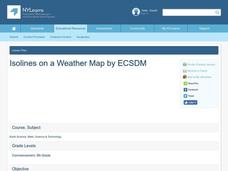
Isolines on a Weather Map
Ninth graders recognize isolines on a weather map and draw isolines based on temperature data on a weather map. They draw isotherms on a weather map to identify temperature patterns.
PBS
Investigating Seasonal Temperature and Precipitation Variations
Weather seems unpredictable, but is it really? Learners collect weather data from online interactives and build data displays. They use their displays to identify temperature and precipitation patterns in different areas.
PBS
Regional Patterns of Climate: Pacific Northwest
Climate systems involve sunlight, ocean, atmosphere, ice, land forms, and many other factors. Scholars explore each of these variables related to the Pacific Northwest rain forest. They use an online interactive to investigate the polar...
NASA
Air Temperatures Around the World: Student Activity
Check out climate anomalies just like NASA climatologists! Investigators use a GISTEMP map from NASA to analyze one month of climate anomalies. Scientists look for data extremes and generate possible explanations for observable patterns.
NASA
Blossoms Blooming: Analyzing Plant Growth Patterns
Could the seasons be changing? Using National Park data, learners recognize patterns in the growth of seasonal plants. They look specifically at the first bloom date of cherry blossoms in Washington DC and compare them to temperature...
Curated OER
Temperature and the Tomato
You will need a photovoltaic system and monitor at your school in order to obtain all of the data required to thoroughly implement this instructional activity. Your class monitors daily temperature and insolation amounts over a two week...
Curated OER
Linkages Between Surface Temperature and Tropospheric Ozone
High schoolers use data microsets of mean near-surface air temperature and tropospheric ozone residual averages to infer patterns. Students analyze changes in tropospheric ozone and then hypothesize about the consequences of these changes.
NASA
Data Literacy Cube: Global Atmospheric Temperature Anomaly Data
Evaluate global temperature anomalies using real-world data from NASA! Climatologists analyze a data set using a literacy cube and differentiated question sheets. Team members evaluate global temperature anomaly data with basic...
NOAA
Graphing Temperatures
Battle of the hemispheres? In the fourth installment of a five-part series, young oceanographers use the NOAA website to collect temperature data from drifters (buoys), one in the Northern Hemisphere and one in the Southern Hemisphere....
Pingry School
Gas Pressure and Temperature Relationship
Humans tend to huddle together when cold and move around more when warm, but do gas particles follow the same pattern? Scholars use a temperature probe, a pressure sensor, and air to study the relationship between temperature and gas...
Curated OER
Temperature High and Lows
Students gather high and low temperature readings through email. In this temperature graphing lesson, students use a spreadsheet to input data for a graph. students interpret the graphs to compare and contrast the data from different...
Curated OER
Ocean Currents and Sea Surface Temperature
Students use satellite data to explore sea surface temperature. They explore the relationship between the rotation of the Earth, the path of ocean current and air pressure centers. After studying maps of sea surface temperature and ocean...
Curated OER
Feeling the Heat
Pupils record temperatures at different locations around campus. They examine the results and draw conclusions about how materials and colors affect the amount of heat produced. They also analyze Los Angeles' temperature records over a...
Curated OER
What Causes Irregular Temperature Patterns?
Students examine common trends in climate across the U.S. They identify the anomalies in hot-cold temperature differences in the U.S and locate them on the map using latitude and longitude coordinates.
Chicago Botanic Garden
Climate Change Around the World
Look at climate change around the world using graphical representations and a hands-on learning simulation specified to particular cities around the world. Using an interactive website, young scientists follow the provided directions to...
Chicago Botanic Garden
Historical Climate Cycles
Scientists use ice core samples to obtain temperatures of the earth from 400,000 years ago! The third of five lessons instructs pupils to interpret historical climate data to see changes over time. In part I, participants interpret...
Space Awareness
Continental Climate and Oceanic Climate
There's nothing better than a cool breeze blowing in from the ocean. Scholars explore how water affects change in temperature using a hands-on experiment on climate. They use measurement tools to compare the continental and oceanic...
CK-12 Foundation
Inequalities that Describe Patterns: Freezing Cold Comparison
Don't freeze out the interactive on inequalities from your lesson plans. Young mathematicians use an interactive thermometer and number line to compare freezing temperatures. Inequalities help express these comparisons.
Curated OER
Introducing Temperature Measurement
Learners explore temperature and use Celcius thermometers to measure and graph the temperature in the classroom daily. They estimate what they think the temperature might be and then find the actual temperature in the room.
Curated OER
Sun and Temperatures
Students consider the relationship of temperature to environmental conditions and then apply their knowledge to a practical event. The task assesses students' knowledge and application of that knowledge to an additional situation.
Curated OER
Introducing Temperature Measurement
Pupils read a thermometer, associate weather conditions and seasons with temperature changes and keep a record of daily temperature.
Curated OER
Curriculum Activities: Ecological Concepts
Students explore a variety of microclimates to develop an awareness of why organisms live where they do. Moisture, time of day, land cover, and temperature form the basic concepts of this investigation.


