Polar Trec
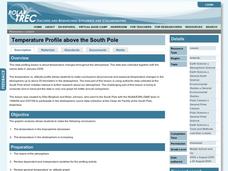
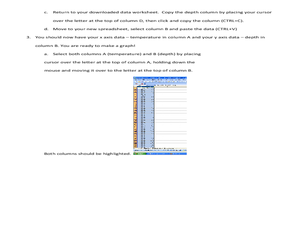
Temperature Profile above the South Pole
Collecting and understanding data is a big part of understanding the world and how it changes. To better grasp what temperatures are changing and how they affect global populations, learners create a graph based on the date provided....
Curated OER
Changing Planet: The Warming of Our Large Lakes - Reasons for Concern
Another A+ instructional activity on the impact of climate change comes to you from the National Earth Science Teachers Association. In this installment, learners model the stratification of water in lakes due to temperature differences....
Curated OER
Ocean Currents and Sea Surface Temperature
Students use satellite data to explore sea surface temperature. They explore the relationship between the rotation of the Earth, the path of ocean current and air pressure centers. After studying maps of sea surface temperature and ocean...
Curated OER
Using Vegetation, Precipitation, and Surface Temperature to Study Climate Zones
Young scholars begin their examination of the climate zones found around the world. Using a software program, they identify the relationship between the vegetation, climate and temperatures of the different zones. They also plot...
Curated OER
Temperature and the Earth's Atmosphere
Earth science super stars visit the National Earth Science Teachers Association's interactive website to glean information on the layers of the atmosphere. Data tables are provided for them to record what is collected. This assignment...
Curated OER
Trends of Snow Cover and Temperature in Alaska
High schoolers gather historical snow cover and temperature data from the MY NASA DATA Web site. They compare this data to data gathered using ground measurements from the ALISON Web site for Shageluk Lake. They graph both sets of data...
Curated OER
What's A Water Column Profile?
Students investigate water column data. In this earth science and seawater lesson, students determine how temperature, salinity, and density have an impact on sea water by viewing and analyzing data obtained from a number of websites....
Colorado State University
If Hot Air Rises, Why Is it Cold in the Mountains?
Investigate the relationship between temperature and pressure. Learners change the pressure of a sample of air and monitor its temperature. They learn that as air decreases its pressure, its thermal energy converts to kinetic energy.
Curated OER
High Mountain Retreat
Students explore and analyze atmospheric conditions for a high mountain retreat. They examine the relationship between altitude, atmospheric pressure, temperature and humidity at a particular location. In addition, they write reports...
Curated OER
Water Resource Engineering
Young scholars examine solubility and the significance of water. In this aqueous solution lesson plan students complete a lab activity on soil profiles.
NOAA
Ocean Layers II
Now that you know the ocean has layers, let's name them. The seventh installment of a 23-part NOAA Enrichment in Marine sciences and Oceanography (NEMO) program covers terminology associated with ocean layers, such as thermocline and...
NOAA
The Oceanographic Yo-yo
How does chemistry help deep-sea explorers? Part four of a five-part series of lessons from aboard the Okeanos Explorer introduces middle school scientists to technologies used in ocean exploration. Groups work together to analyze data...
Curated OER
Where's the Oxygen?
Young scholars study seawater and how temperature and salinity influence it. In this oxygen lesson students complete a lab activity on dissolved oxygen.
Curated OER
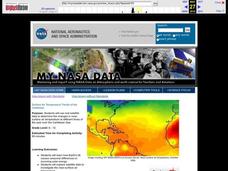
Surface Air Temperature Trends of the Caribbean
Students investigate the seasonal changes to sea surface and near-surface air temperatures near the equator. They use actual satellite data to track and graph the differences in air and sea temperatures during different seasons in the...
Curated OER
Trends of Snow Cover and Temperature in Alaska
Learners compare NASA satellite data observations with student surface measurements of snow cover and temperature. They practice data collection, data correlations, and making scientific predictions.
Curated OER
Hurricane Frequency and Intensity
High schoolers examine hurricanes. In this web-based meteorology lesson plan, students study the relationship between ocean temperature and hurricane intensity. They differentiate between intensity and frequency of hurricanes.
PHET
The Greenhouse Effect
How do greenhouse gases impact temperature? Have your classes use the interactive software to explore different concentrations of greenhouse gases and their effect on climate. Learners can recreate different atmospheric concentrations...
Curated OER
(S-1A) Weather and the Atmosphere
High schoolers discuss the way vertical convection transports heat from the surface upwards, and associated pressure and temperature profiles of the atmosphere.
Curated OER
# 18 Determination of the Set Time for Epoxy Adhesive
Students recognize epoxy glue formation as two part polymerization (usually the curing agents act as co-monomers). They monitor the reaction by the changes in viscosity of the reacting mass, the temperature rise and fall, and the...
NOAA
A Matter of Density
Larvae transportation on the New England seamounts is based on the density of the water. Scholars calculate density and graph salinity versus temperature to better understand the distribution of organisms in a water column. Discussions...
PHET
Battery-Resistor Circuit
Don't be resistant to physics! A simulation shows classes how a resistor works. Change the battery voltage and resistance to show how this affects the flow of electrons. Temperature and amps measurements are shown for the system as well.
Curated OER
Cool Liquids
Chemistry neophytes use a temperature probe to assess the change as five different liquids evaporate. The implantation section suggests that they take readings every five seconds for a total of four minutes. They graph the data, look up...
Curated OER
Linkages Between Surface Temperature And Tropospheric Ozone
Learners collect and interpret data to make predictions about the levels of ozone in the atmosphere. Using the internet to collect data students use their collected data to create a line graph for analysis. Learners make mathematical...
NOAA
A Quest for Anomalies
Sometimes scientists learn more from unexpected findings than from routine analysis! Junior oceanographers dive deep to explore hydrothermal vent communities in the fourth lesson in a series of five. Scholars examine data and look for...


