Concord Consortium
Center of Population
Let the resource take center stage in a lesson on population density. Scholars use provided historical data on the center of the US population to see how it shifted over time. They plot the data on a spreadsheet to look the speed of its...
College Board
Sampling Distributions
The validity of data depends on the strength of the sample. A collection of instruction and activities focuses on sampling distributions and the analysis of that data. Scholars learn about distribution tests such and Central Limit...
Curated OER
Human Population- Changes in Survival Rates Data Interpretation
In this human population changes in survival worksheet, students interpret and plot data to understand the differences in human mortality and survivorship between historic and modern times. They investigate how these changes influence...
Inside Mathematics
Population
Population density, it is not all that it is plotted to be. Pupils analyze a scatter plot of population versus area for some of the states in the US. The class members respond to eight questions about the graph, specific points and...
Curated OER
What is the Population Distribution of Cartoon Characters Living On the Pages of Your Newspaper?
Students read various cartoons in their local newspaper and calculate the population demographics, spatial distribution and grouping of the characters. Using this information, they create a population distribution map and share them with...
Curated OER
Social Studies: Area and Population Density
Math scholars of many ages examine the concept of population density and then discuss the significance of the population densities of Minnesota and China. They figure the population density of their school.
Curated OER
Population Pyramids
Students explain the significance of population trends on world regions. They define relevant population vocabulary and examine age-gender patterns at various scales.
Curated OER
Size It Up: Map Skills
Compare information from a US population cartogram and a standard US map. Learners draw conclusions about population density by analyzing census data a population distribution. They discover that census data is used to apportion seats in...
US Department of Commerce
Over the Hill - Aging on a Normal Curve
Nobody is too old to learn something new. Young statisticians analyze census data on the percentage of the population older than 65 years old in US counties. They fit a normal distribution to the data, determine the mean and standard...
Curated OER
Human Populations Studies: the Ghost of Populations Past
High schoolers compile data on population distribution and develop survivorship curves using information from cemetery tombstones and obituaries. They develop inferences on the changes in population age distribution in their area over time.
Curated OER
The Ghost of Populations Past
Students study population distribution and survivorship curves by collecting data regarding age of death of humans from either tombstones, newspapers, or other community resources. Students analyze data by creating graphs and population...
CK-12 Foundation
Sampling Distribution of a Sample Mean: The Mean of the Average Ages
What does it mean to take the mean of the mean? An easy-to-use interactive has users adjust the mean ages of different samples. Finding the average of these sample means gives an estimate of the population mean.
Curated OER
In the Wake of Columbus
Students explore how the population decreased in native cultures.
Curated OER
Wealth Dispersal in the US
Some handouts speak for themselves. Give your economics class a better grasp on the dispersal of wealth in America. The handout compares the total US wealth to 100 dollars. A graph then shows how that 100 dollars is distributed amongst a...
Curated OER
Race and Ethnicity in the United States
Students explore race and ethnicity as it is defined by the U. S. Census Bureau. They compare data from 1900, 1950, and 2000 and identify settlement patterns and changes in population. In groups, they map these changes and discuss...
Curated OER
Distribution of children living at home
Learners use E-STAT to examine demographics. In this social demographics lesson, students use statistical data to determine if a particular family is in need of assistance. Learners will discuss social and educational policies and...
Curated OER
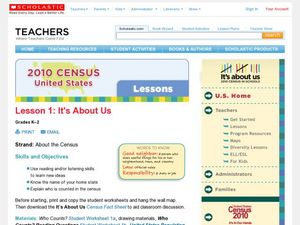
2010 Census Lesson 1: It's About Us
Students analyze data from the 2000 census to learn how the census works. In this civics lesson, students read a story to find out about the census, then use a map and census data to analyze changes. Lesson includes related resources...
Curated OER
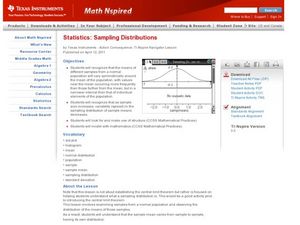
Sampling Distributions
Students analyze sampling from different population. In this statistics lesson, students define the meaning of sample sizes and what causes an increase or decrease. They graph their data on the Ti calculator and draw conclusion from the...
Georgia Department of Education
Math Class
Young analysts use real (provided) data from a class's test scores to practice using statistical tools. Not only do learners calculate measures of center and spread (including mean, median, deviation, and IQ range), but also use this...
Curated OER
Why We Count
Learners visualize census data on a map and use a map key to read a population map. In this census lesson, students use a map of the Virgin Islands and corresponding worksheets to gain an understanding of population density.
Curated OER
Satellite Images- Night Time
Fourth graders study the geography and population distribution of various places on earth. They utilize actual satellite images of the night sky (lights showing heavily around area of dense population) to study and make observations...
Curated OER
Hunger in the World
Consider various aspects of world hunger in this writing lesson. After taking a pre-test, middle and high schoolers play a map game, analyze and discuss world statistics, and write a report on an assigned country. The lesson can apply to...
US Department of Commerce
Featured Activity: Let’s Get the Count Right
Don't leave anyone out. To highlight the importance of the US Census to younger learners, an activity has them distribute markers to see if there are enough for each person. They see that counting the population is necessary to fairly...
Curated OER
Mapping Counties
Learners practice reading a map. In this mapping lesson, students illustrate a map and compare and contrast the counties based on their population. Learners also explore what a census is and read census data on a map. A student...


