CK-12 Foundation
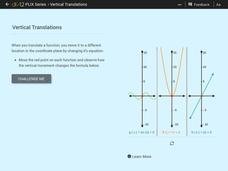
Vertical Translations
Change the y-intercept by adding a constant to the function. Individuals move three functions vertically along the y-axis. As they observe how the equation of the functions change with the vertical movement, learners determine how to...
Balanced Assessment
Dollar Line
Challenge the class to develop a story that matches a graph. The short assessment provides a line graph with the vertical axis labeled as dollars. The task asks pupils to develop a description of a situation that could be represented by...
K-5 Math Teaching Resources
Blank Bar Graph Template
This template is just begging for your young mathematicians to fill it in with colorful bar graphs! With horizontal and vertical axes in place and grid lines for added support, this is a great resource for teaching children how to...
Curated OER
Visualizing and Naming Polygons
A really useful resource contains 116 slides covering basic geometric concepts related to 2-D or plane shapes. Shape properties, translations, reflections, congruence, symmetry, and grid work are all laid out in a comprehensive and...
Curated OER
Worksheet 25
In this math worksheet, students draw a graph of functions on a polar graphing system. They graph two functions by first plotting them on the vertical axis as a function of a given angle, then by plotting them at a radial distance from...
Curated OER
Graphing a Line Parallel to an Axis
For this Algebra I/Algebra II worksheet, students graph lines parallel to an axis. The one page worksheet contains one multiple choice question with the answer.
Curated OER
Using the Distance Formula
In this distance formula worksheet, students solve and complete 30 various types of problems. First, they find the exact distance between each pair of points and make a sketch of the situation. Then, students find the center, horizontal...
Concord Consortium
Quadratic Reflections
Reflect upon the graphs of quadratic functions. Given a quadratic function to graph, pupils determine whether the graph after a horizontal and vertical reflection is still a function. The final two questions ask scholars to describe a...
Curated OER
Graphing Ordered Pairs
Here is graphing worksheet which has pupils graph ordered pairs and label the axis. They graph five ordered pairs and then interpret the data in the graph.
Purdue University
Sun Tracking System for a Solar Panel
Capture the Sun's rays as best as possible. An engaging STEM lesson teaches scholars about how Earth's tilt causes the path of the sun to change throughout the year. They create solar panel systems that move both horizontally and...
Curated OER
Cool Cars
Young scholars travel one at a time in a straight-line path and attempt to maintain a constant velocity. While one student walks, jogs, or runs, the other group members time the "runner" while standing at five-meter intervals along the...
EngageNY
Exploring the Symmetry in Graphs of Quadratic Functions
Math is all about finding solutions and connections you didn't expect! Young mathematicians often first discover nonlinear patterns when graphing quadratic functions. The lesson plan begins with the vocabulary of a quadratic graph and...
Curated OER
Equations of Ellipses
In this writing equations of ellipses worksheet, students solve and complete 26 various types of problems. First, they use the given information to write the standard form equation of each ellipse. Then, students determine the endpoint...
Curated OER
Magnetic Storms
In this magnetic storms worksheet, students use a graph of data collected over time showing the magnitude of a magnetic storm. Students use the data to solve 6 problems about the graph and they determine the strength of the storm at...
Curated OER
Using the Balance
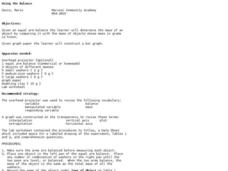
Students determine the mass of various objects. In this integrated math and science lesson, students use an arm balance to compare a known object to a combination of washers with a fixed weight. Students record data, construct a bar...
Curated OER
Usage and Interpretation of Graphs
Students explore graphing. In this graphing instructional activity, students predict how many shoe eyelets are present in the classroom. Students count eyelets and work in groups to organize and chart the data collected. Students put all...
Curated OER
Learn How to Graph
Students examine various types of charts and discover how to construct a line graph. Using graph paper, they construct a graph displaying weight loss over a five-year period. They draw copnclusions from the completed graphs.
Curated OER
Human Population Growth
In this human population growth worksheet, students create a graph of human population growth and predict future growth using the data given in a chart. Students identify factors that affect population growth.
EngageNY
Analyzing Graphs—Water Usage During a Typical Day at School
Connect your pupils to the problem by presenting a situation with which they can identify. Individuals analyze a graph of water use at a school by reasoning and making conclusions about the day. The lesson emphasizes units and labels of...
EngageNY
The Geometric Effect of Some Complex Arithmetic 1
Translating complex numbers is as simple as adding 1, 2, 3. In the ninth lesson in a 32-part series, the class takes a deeper look at the geometric effect of adding and subtracting complex numbers. The resource leads pupils into what it...
Curated OER
Histograms: Homework
In this histograms activity, students learn how to make a histogram. Students give graphs a title, draw the axes, label the vertical axis, choose an appropriate scale, and mark equal intervals. Students label the horizontal axis with the...
Concord Consortium
Functions by the Slice
Piece by piece ... dismantling a function can highlight interesting patterns. The task asks learners to slice functions in sections with the same vertical change. They then recreate the graph with these slices positioned horizontally....
Terry Kawas
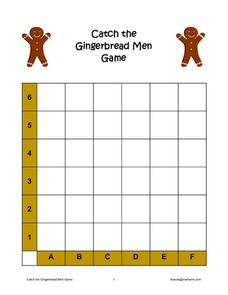
Catch the Gingerbread Men Game
Catching men made of gingerbread motivates your young graphers to begin exploring the concept of finding a point in two-dimensional space. Learners practice locating each cookie by rolling two cubes (one with the letters a through f and...
EngageNY
Projecting a 3-D Object onto a 2-D Plane
Teach how graphic designers can use mathematics to represent three-dimensional movement on a two-dimensional television surface. Pupils use matrices, vectors, and transformations to model rotational movement. Their exploration involves...


