CK-12 Foundation
Average and Instantaneous Rates of Change
How can you determine the rate of change on a curve? Pupils use the interactive to discover what happens with the average rate of change as the point move closer to the other. Using the definition of the derivative, learners find that it...
EngageNY
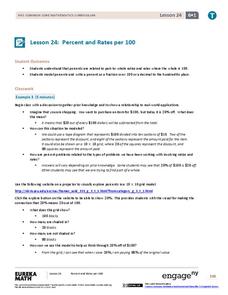
Percent and Rates per 100
What percentage of your class understands percents? Pupils learn the meaning of percents based upon rates per 100 in the 24th instructional activity in a series of 29. They represent percents as fractions, decimals, ratios, and models....
CK-12 Foundation
Formulas for Problem Solving: Finding Distance, Rate, and Time
Go the distance in learning about distance, rate, and time. Young mathematicians use an interactive to investigate the relationship between distance, rate, and time. A set of challenge questions assesses understanding of these...
CK-12 Foundation
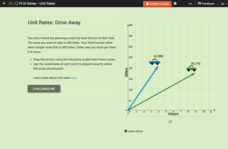
Comparison of Unit Rates: Drive Away
Five questions make up an interactive that challenges mathematicians to compare unit rates. Word problems question scholars about two friends going on a road trip. Scholars manipulate two cars on a coordinate plane to help solve word...
Media Smarts
Television Broadcast Ratings
Explore the relationships between programming, advertising, and the ensuing rating wars. Help develop the media smarts of your pupils through this examination of advertisers for popular shows. Although the included Sweep Chart features...
CK-12 Foundation
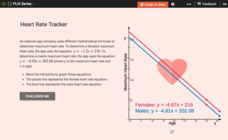
Graphs of Linear Systems: Heart Rate Tracker
Max out heart rates for males and females. Formulas of maximum heart rates provide the equations for a linear system. Pupils use the interactive to graph the equations for males and females and determine their points of intersection. The...
CK-12 Foundation
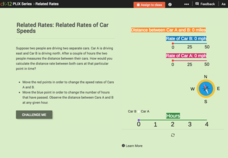
Related Rates of Car Speeds
Speed up your pupils' understanding of derivatives. Two cars travel in perpendicular distances to each other. With the aid of the interactive, learners visualize the situation. Pupils use the derivative to calculate the instantaneous...
Curated OER
The Learning Network: Reactions to Rating Teachers
Meant to be used in connection with the article "In Teacher Ratings, Good Test Scores Are Sometimes Not Good Enough" also available on The New York Times website, this resource provides 12 short-answer writing prompts that ask both basic...
Curated OER
Heart Rate
Students move through a variety of locomotor skills at different paces to see how they affect their heart rate. In this health, human body, and physical activity lesson plan, students measure their heart rate and discuss health. A...
Curated OER
Corporate Tax Rate and Jobs
Does lowering the corporate tax rate help create jobs in the United States? Learners explore the top pro and con arguments and quotes relating to the issue. They read background information about the creation of the federal corporate...
Curated OER
Temperature Affects The Heart Rate
Learners relate heart rate and development to environmental conditions through experiment. In cooperative groups, students record the heart rate in developing zebra fish. Groups create a standard curve to predict the temperature at...
Council for Economic Education
Unemployment Data: Is the Economy Healthy?
The United States will never see a time when the unemployment rate hits 0%. Why? Scholars research economic data to uncover clues hidden in the unemployment rate at any given time. A short video as well as research activities help...
Curated OER
Heart Smart in a Heart Beat
As an introductory activity, young statisticians measure their heart rate at rest and after exercise and compute the mean and median, and create a box & whisker plot. This is followed by watching a video (that no longer seems to...
Curated OER
Classroom Heart Rates
Students check and record heart-rates of other classmates. They compare and design questions to explain the differences in their findings. Possible explanations might include: the effects of culture, lifestyles, age and gender on heart...
Curated OER
I Wonder How Fast Manduca Grows Compared To Me
Students study the Manduca bug and its growth data. They look for patterns and compare their own growth rate to that of the Manduca.
Texas Education Agency (TEA)
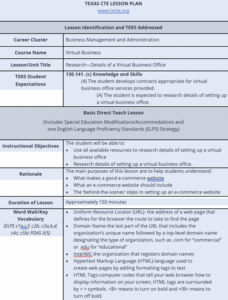
Research - Details of a Virtual Business Office
It's business as usual! Using the resource, scholars learn the fine details of setting up a virtual business, including what makes a good eCommerce website. Next, they research their favorite businesses and complete an evaluation form to...
Curated OER
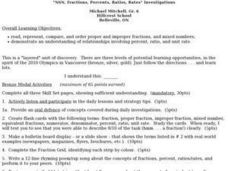
"NSN, Fractions, Percents, Ratios, Rates" Investigations
Sixth graders engage in an investigation about the concepts related to fractions. They read, represent, compare, and order proper and improper fractions, and mixed numbers. They demonstrate an understanding of relationships involving...
Mathalicious
Domino Effect
Carryout the lesson to determine the cost of pizza toppings from a Domino's Pizza® website while creating a linear model. Learners look through real data—and even create their own pizza—to determine the cost of each topping. They explore...
Curated OER
Iditarod-Statistics and Rates
Students analyze data from the Iditarod race. In this data analysis lesson, students work in pairs to analyze data and answer several questions such as, "what is the difference in the rate of travel" and "how much more prize money does...
Tidewater Community College
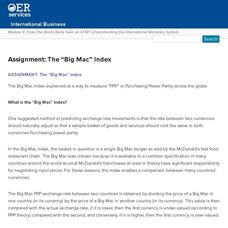
Assignment: The “Big Mac” Index
Young economists learn about the method of predicting changes in the exchange rate with Big Macs in an instructional video. After an understanding the index, learners write a post on a discussion board and respond to class members' posts...
Council for Economic Education
Economic Data Lesson: Economic Policy Options
Can you make decisions that will impact millions of people around the nation? Scholars research the role of the Federal Reserve, and its Chairman, on the economic outlook of the country. They analyze current trends in unemployment,...
CK-12 Foundation
APR and APY: APR vs. APY
Who wins the battle of the interest rates? Scholars use an interactive to investigate three different bank rates. Comparing APR and APY lets them see how nominal and effective rates differ.
National Research Center for Career and Technical Education
Business Management and Administration: Compound Interest - A Millionaire's Best Friend
Many math concepts are covered through this resource: percentages, decimals, ratios, exponential functions, graphing, rounding, order of operations, estimation, and solving equations. Colorful worksheets and a link to a Google search for...
California Education Partners
Animals of Rhomaar
Investigate the growth rates of alien animals. Pupils study fictional animals from another planet to determine how much they grow per year. The investigators plot the growth of their animals over a period of time and then compare them to...


