Curated OER
Get a Half-Life Student Worksheet
Young scientists use a worksheet to help them perform a lab on the decay of a radioactive element. The worksheet serves as both a task guide and a lab sheet for pairs of learners. This activity requires a calculator and has excellent...
Teachnology
Statistics & Probability with Cards
Give young mathematicians a chance to demonstrate their understanding of basic probability with this series of worksheets. Presented with different situations involving dice and decks of cards, students must correctly determine the...
Curated OER
Comparing School Bus Stats
Engage in a lesson plan that is about the use of statistics to examine the number of school buses used in particular states. They perform the research and record the data on the appropriate type of graph. Then they solve related word...
University of California
Student Workbook: Statistics and Probability
Statistically, practicing this packet completely helps young mathematicians do well on the test. The packet is adaptable to many grade levels as it includes basic probability and goes up to data analysis with mean, median, and mode.
Curated OER
Get a Half-Life!: Student Worksheet
In this math/science worksheet, young scholars will work in pairs to conduct an experiment based on a decay function which is often used to model radioactive decay. Students will shake M & M's in a cup to rub off the M and then...
Curated OER
Get a Half Life!: Student Worksheet
Upper elementary or middle schoolers will explore non-linear functions, graphing, and the curve of best fit through real-life data collection and trial analysis. They explore the concept of half-life and radioactive decay using M&Ms,...
David Pleacher
Candy Math Fun
Few things can motivate children to learn like the promise of a sweet and tasty treat. Given a bag of M&M®s, Skittles®, or other colorful candy, students first predict the contents of the bag before counting the pieces, creating a...
Curated OER
Linear Regression on TI-83
In this linear regression worksheet, students use TI-83 calculators to graph linear regressions. Instructions for using the calculator are provided. This two-page worksheet contains six problems.
Curated OER
Linear Regression on TI-86
In this linear regression worksheet, learners solve linear regression problems using the TI-86 calculator. Detailed instructions on how to use the calculator are provided. This one-page worksheet contains seven problems.
Curated OER
Linear Regression on TI-82
In this linear regression worksheet, students graph linear regression problems using the TI-82 calculator. Instructions for using the calculator are provided. This two-page worksheet contains six problems.
Curated OER
The Handley Sports Problem
In this probability worksheet, 11th graders analyze how many students participate in four different sports using the probability of an event ocurring. There are 4 questions on this worksheet.
Curated OER
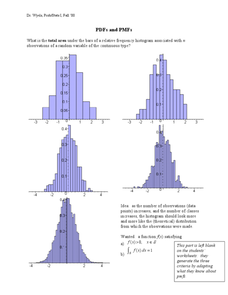
PDF's and PMF's
In this probability worksheet, students solve for the area under the frequency histograms. They identify the area using the derivative. There are 3 questions.
Curated OER
New York State Mathematics Exam
In this math instructional activity, students review for the exam given by the state of New York. There are 16 pages and 27 questions in this booklet covering topics from algebra, geometry and statistics.
Curated OER
There Was An Old Lady Who Swallowed Some Leaves Storia Teaching Guide
There was an old lady who swallowed some leaves? Little learners read a new version of the old swallow story with a fall twist as they try to answer the big question; Why is that lady swallowing all that weird stuff? The teacher's guide...
Curated OER
Pie Charts
In this math worksheet, students complete the work in order to chart the data into the pie graph. The picture is used for statistical analysis.
Florida Department of Health
Safe and Happy: Safety for All at School and Online Unit
Bystander or upstander and advocate? Three lessons have high schoolers investigating data about bullying and school safety. Participants then learn how to take a stand against bullying and use what they have learned to create a PSA to...
Curated OER
A Ststistical Study on the Letters of the Alphabet
In this Statistics and Probability worksheet, students create a line plot for the first 100 letters in the Preamble to the constitution and compare their frequency distributions to the actual frequency distribution. The one page...
Curated OER
Smoking Today = Smoking Tomorrow
Examine statistical data to recognize the relationship of statistics to real-world issues. Pupils navigate e-stat using the Internet and find data about social issues. They complete a worksheet with their data and create an anti-smoking...
Saxon
Plotting Functions
Youngsters use a graphing calculator to assist in creating a function table. They graph the function on a coordinate plane. They explore the relationship between the domain and range in the graph. This four-page worksheet contains two...
Curated OER
Writing a Newspaper-Style Article
Help your secondary reader/writers assess texts by studying press releases from Statistics Canada and drafting articles based on them. They then compare the press release, their own articles, and actual news stories they find online. I'd...
Curated OER
How does Your Province Stack Up?
Young scholars investigate data about age, and sex of a population. In this statistics instructional activity, students are given data on a population to analyze and compare to other provinces. This assignment is part of a geography...
Curated OER
States of Consciousness
In this social psychology activity, students answer 10 multiple choice question quiz on states of consciousness, REM and sleeping.
Curated OER
Pie Chart
For this literacy worksheet, students use the created resources for further progress towards knowledge. The sheet is a teacher's guide for creating student resources.
Curated OER
School Population
In this math worksheet, students solve the problem of creating ratios for the school population. There is an example on page 1.


