Flipped Math
Correlation
Determine how close the line is to the scatter plot. Clear video instruction shows how to plot a scatter plot and find the best fit line using the linear regression function on a calculator. Pupils use the information from the calculator...
CK-12 Foundation
Going Fishing
Why do some things float and others sink? A creative simulation allows learners to adjust mass and volume of an object to affect its buoyancy in water. A graph records the effect of each manipulation.
CK-12 Foundation
Flashlight
In a simple circuit, does electricity start instantly? A simulation encourages thinking about the flow of electrons at a microscopic level. Pupils control the voltage, resistance, and switch in order to observe the change in both ideal...
CK-12 Foundation
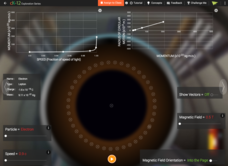
Particle Tracks
Did you know physicists can identify new particles by observing the path they take in a particle accelerator? Scholars explore the variables that determine the direction and radius of the circular path different particles take. They...
Other popular searches
- Graphs Interpreting Data
- Graphs and Data Display
- Continuous Data Graphs
- Circle Graph Data Set
- Extrapolation Graphs Data
- Graphs and Data
- Graphs and Data Handling
- Graphs Analyze Data
- Science Data and Graphs
- Pictorial Data Graphs
- Analze Data and Graphs
- Graphs Data Handling


