Helping with Math
Ratio and Proportion: Simplifying Ratios (1 of 2)
Here is a set of 24 pairs of numbers for which kids reduce the ratios to their simplest form. It is a simple and straightforward assignment, meant by the publisher to address CCSS.Math.Content.6.RP.3. Note, however, that it only requires...
Curated OER
The Circle's Measure
Pupils explore circumference and diameter. In this math lesson, students apply their knowledge of circumference and diameter to solve mathematical riddles. Pupils apply this knowledge to find circumference and diameter of various objects.
Curated OER
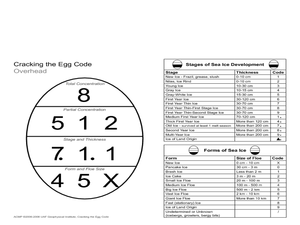
Sea Ice: Cracking the Egg Code
Young scholars study the egg code to learn about sea ice. In this sea ice lesson, students discuss and view a diagram to learn about the egg code when describing sea ice and its thickness. Young scholars work in groups to play a game...
Curated OER
Mathematical Magazines
Students look through magazines and calculate the percentages of the types of ads in the magazines. In this percentages lesson plan, students create a graph to show their results.
Curated OER
Who is Being Left Behind?
Students investigate scores as they relate to race. In this algebra lesson, students analyze standardized scores and how race can affect these scores. They plot their findings on a graph and draw conclusions.
Curated OER
A McTrip Back In Time
Students pretend they are time-travellers and travel back to 1954 to a McDonald's Restaurant to see how prices have changed. They need to add and subtract money with regrouping.
Curated OER
Better Than Average
Students analyze how to calculate averages, and discuss the use of averages in baseball. They calculate averages and decimals to thousandths using the data on baseball cards.
Curated OER
Our Favorites
Learners participate in and conduct a survey to determine various class favorites. They collect, organize and display their data, interpret the results, and complete a packet of worksheets to display the information.
Curated OER
Finding Sales Tax
Seventh graders investigate sales tax. Following a teacher demonstration, they find sales tax and the total cost of items. In groups, classmates choose items from a menu that they would like to purchase. Each student figures the sales...
Curated OER
Patterns in Pascal's Triangle
Young scholars examine the patterns that exist in Pascal's Triangle. They explore multiples and factors. Sudents use an applet to create and color the multiples in Pascal's Triangle.
Curated OER
Fickled Fractions
Students explore which fractions are made real in our world. They also show the relationship of cross multiplication and equivalent fractions To reinforce fraction skills.
Curated OER
Finding Patterns in Fractals
Students discover patterns and sequences. They use a website to explore patterns and fractals. Students share their discovery of fractals and their patterns with the class. They develop a list of patterns used in everyday life.
Curated OER
Multiplying Decimals and Mixed Numbers
Middle schoolers multiply decimals and/or mixed numbers. They explore the effects of multiplying decimals and mixed numbers. They practice estimating answers when a number is multiplied by a decimal or mixed number.
Curated OER
A Statistical Look at Jewish History
Students complete their examination over the Jewish Diaspora. Using population figures, they discover the importance of percentages in exploring trends. They use their own ethnic group and determine how it is represented in the United...
Curated OER
Mathematics Within: Algebraic Patterns
Students investigate the concept of using proportions to compare quantities while also practicing calculations for foreign exchange rates. They develop the skill of solving for unknown quantities of money while using an algebraic equation.
Curated OER
Scale Me Down
Students create scale drawings, and ultimately scale models, of real-world objects in this Math lesson about ratios, proportion, scaling factors, and cross products. The lesson includes ideas for cross-curricular extensions and is...
Shodor Education Foundation
Tree Diagrams and Probability
Aspiring statisticians create tree diagrams and figure probabilities of events based on those diagrams. They practice adding and multiplying fractions and explain complementary probabilities. Students use computers activities to make...
Curated OER
Childhood Obesity
Students identify a question to generate appropriate data and predict results. They distinguish between a total population and a sample and use a variety of methods to collect and record data. Students create classifications and ranges...
Curated OER
Intro To Probability
Students investigate the concepts related to the practice of using probability. They review the use of mean, median, and mode within the context of previous instruction. Students predict outcomes and calculate them in small groups. The...
Curated OER
Population Ratios
Students access web site and record various population statistics pertaining to a county in the USA of their choice. They use this data to set up and solve ratios. They compare data to make meaning of the numbers.
Curated OER
Cannot Buy Me Love
Students investigate the concepts that are related to finance and how it is used in the world. They take part in activities that are focused around the use of a spreadsheet while using a T-chart to simulate a ledger of credits and debits.
Curated OER
Aldridge Sawmill - The Story in Numbers
Seventh graders practice math skills while becoming familiar with Texas' "Boom & Bust" economy and the natural history of the east Texas Piney Woods. They utilize worksheets and websites imbedded in this plan.
Curated OER
Aldridge Sawmill - The Story in Numbers
Seventh graders view overhead maps of Texas, explore history of Aldrige Sawmill, and practice math skills while becoming familiar with Texas' "Boom & Bust" economy and natural history of east Texas Piney Woods.
Curated OER
Aldridge Sawmill -- The Story in Numbers
Seventh graders view a recent transparency of the average rainfall zones of the state of Texas. Using another transparency, they identify the Piney Woods subregion of the Gulf Coastal Plain and locate national forests and sawmills. ...
Other popular searches
- Percent Word Problems Ratios
- Math Percent Word Problems
- Solving Percent Problems
- Solve Percent Problems
- Hands on Percent Problems
- Algebra Percent Problems
- Math Percent Problems
- Combination Percent Problems
- Percent Problems Budget
- Percent Problems Udget
- "Word Problems" Percent Off
- Story Problems Percent


