Flipped Math
Calculus AB/BC - Defining the Derivative of a Function and Using Derivative Notation
Pupils learn how to find the derivative of a function by applying the definition using limits. Learners understand that the derivative provides the slope of the tangent line and use that information to find the equation of the tangent...
Curated OER
Slope Fields
Students create and analyze slope fields. In this calculus lesson, students create a visual of differential equations. They use the Ti Navigator to create slope fields.
Charleston School District
Solving Systems Graphically
When guess and check gets old, it's time to start graphing! An instructive lesson explains how to solve a system of linear equations using graphing. Equations are in both slope-intercepts and standard form.
Curated OER
Rise Over Run
Students define the slope of the line, find the slope between any two points on the line, and allow them to name other areas where the slope is used. They explain why the slope is defined as the rise over the run.
Curated OER
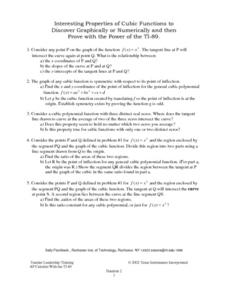
Interesting Properties of Cubic Functions to Discover Graphically or Numerically
Learners investigate the slope of a cubic function. They find the tangent line of the cubic function at point P, and discuss the relationship between point P and point Q, the point the tangent line intersects the cubic function. ...
Curated OER
Mathematical Modeling
Study various types of mathematical models in this math instructional activity. Learners calculate the slope to determine the risk in a situation described. They respond to a number of questions and analyze their statistical data. Then,...
Curated OER
Linear and Exponential Functions
This comprehensive unit on linear and exponential functions provides numerous clearly-written worksheets. Topics include graphing linear equations, solving systems of equations algebraically and by graphing, identifying the domain and...
Curated OER
Rates and Slopes: An Astronomical Perspective
In this rates and slopes activity, students solve 2 problems where they find the rate corresponding to the speed of the galaxies in a Hubble diagram for galaxies and they calculate the rate of the sunspot number change between indicated...
Curated OER
Juggling Slopes
Students identify the slope of a line. For this algebra lesson, students label slopes as positive, negative, zero or undefined. They use the slope formula to find the slope algebraically and graphically.
Concord Consortium
Function Project
What if a coordinate plane becomes a slope-intercept plane? What does the graph of a linear function look like? Learners explore these questions by graphing the y-intercept of a linear equation as a function of its slope. The result is a...
EngageNY
Lines That Pass Through Regions
Good things happen when algebra and geometry get together! Continue the exploration of coordinate geometry in the third lesson in the series. Pupils explore linear equations and describe the points of intersection with a given polygon as...
Curated OER
Lines, Lines, Everywhere
Students explore linear equation suing real life scenarios. In this algebra lesson, students find the slope and intercept of a line. They create table of values to plot their graph and draw conclusions.
Curated OER
Linear Modelling of the Life Expectancy of Canadians
Middle and high schoolers explore the concept of linear modelling. In this linear modelling lesson, pupils find the line of best fit for life expectancy data of Canadians. They compare life expectancies of men and women, and find...
Curated OER
Is there Treasure in Trash?
More people, more garbage! Young environmentalists graph population growth against the amount of garbage generated per year and find a linear model that best fits the data. This is an older resource that could benefit from more recent...
Curated OER
Track's Slippery Slope
Middle schoolers graph data of sports figure running time using x-axis y-axis to find slope of trend line, mathematically find the interpolated and extrapolated values for data points. Using the information they make predictions.
Curated OER
Slopes and Lines
Students identify the slopes of a line. In this algebra instructional activity, students calculate the slope and intercept of a line. They graph their lines using a TI calculator.
Curated OER
Exploring the Slopes of Parallel and Perpendicular Lines.
Pupils find the slopes for perpendicular and parallel lines. In this geometry lesson, students differentiate between parallel and perpendicular lines. They use Cabri software to create lines to compare.
Curated OER
Exploring the Slopes of Parallel and Perpendicular Lines
Students calculate the slope of parallel and perpendicular lines.In this algebra lesson plan, students differentiate between parallel and perpendicular lines. They graph their lines using the slope of the equation.
Balanced Assessment
On Averages and Curves
Determine the average on a curve. The class finds graphical representations of averages and expresses them both symbolically and on the graph. The assessment requires class members to justify using average to describe graphs.
Texas Instruments
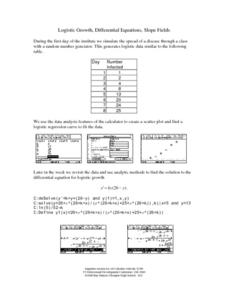
Logistic Growth, Differential Equations, Slope Fields
Investigate differential equations with your class. They use the TI-89 to explore differential equations analytically, graphically, and numerically as the examine the relationships between each of the three approaches.
Flipped Math
Calculus AB/BC - The Power Rule
There has to be a quicker way. Pupils learn the power rule that allows for a shortcut to take the derivative of terms to a power. Using the newly found rule, scholars find the slope of the tangent line to a function at a given x value....
Curated OER
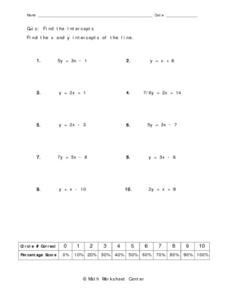
Find the Intercepts
In this intercepts worksheet, 9th graders solve 10 different problems that include determining the intercepts of each equation. First, they set y equal to zero and solve for x. Then, they set x equal to zero and solve for y. They also...
Willow Tree
Graphing
So many methods and so little time! The efficient method of graphing a linear equation depends on what information the problem gives. Pupils learn three different methods of graphing linear equations. They graph equations using...
Curated OER
Skate Party
Learners use the Frayer model during problem solving. In this problem solving lesson, they examine multiple methods of data collection to solve real world problems. Resources are provided.


