Scholastic
Study Jams! Pictograph
An easy and fun way to look at data is with a pictograph. A lesson plan friendly enough for multiple grade levels shows how to set up this graph with a corresponding key. The steps review the importance of choosing an appropriate...
Scholastic
Study Jams! Double-Line Graphs
With two summers of babysitting money, Mia needs a way to compare her earning from both years. Show your learners that they can organize the data onto a double-line graph to easily compare which summer was more profitable. The lesson...
Scholastic
Study Jams! Histograms
With so many ways to organize data, a histogram is useful when we need to graph a variety of ranges. The interactive lesson plan organizes heights into different categories, not too big and not too small, to display on a histogram. The...
Scholastic
Study Jams! Choosing the Correct Graph
With so many types of graphs, don't let your learners get stuck figuring out which one to use. To track how Zoe spent her allowance, use this interactive lesson to review all the types of graphs and pick the best one to display the data....
Bowland
Public Transport
"Statistics is the grammar of science" -Karl Pearson. In the assessment task, learners read a claim made by a newspaper and analyze its conclusions. They need to think about the sample and the wording of the given statistics.
Virginia Department of Education
Scatterplots
Math is all fun and games with this activity! Learners use an activity designed around hula hoops to collect data. They create scatter plots with their data and then analyze the graphs for correlation.
Rice University
Introductory Statistics
Statistically speaking, the content covers several grades. Featuring all of the statistics typically covered in a college-level Statistics course, the expansive content spans from sixth grade on up to high school. Material comes from a...
Curated OER
How Big is the Playground: Creating a Map
Students create a topographical map of an area outside of the school. For this mapping lesson, students compile data on angles, distances, and key landmarks for a predetermined area on the school grounds to create a map using Geometer's...
Howard Hughes Medical Institute
Coral Reefs in Hot Water
Global warming is leaving coral reefs in hot water. What does that mean for their survival? Find out as scholars use authentic satellite data to explore the issue. Learners look for global trends in the data and research the effects the...
American Statistical Association
Nonlinear Modeling: Something Fishy
There are plenty of fish in the sea, but only a few good resources on regression. Young mathematicians first perform a linear regression analysis on provided weight and length data for fish. After determining that a linear model is not...
Curated OER
Systems of Linear Equations
Introduce the inverse matrix method to solve systems of linear equations both algebraically and graphically. Using given data, your class checks their answers with graphing calculators. Handouts are included in this well-thought out lesson.
Virginia Department of Education
Growing Patterns and Sequences
Learners explore, discover, compare, and contrast arithmetic and geometric sequences in this collaborative, hands-on activity. They build and analyze growing patterns to distinguish which kind of sequence is represented by a set of data...
National Research Center for Career and Technical Education
Costing
Your young business men and women discover that selling what they make at a profit is the key in running a business. Learners practice the contextual math needed in the CTE lesson; then apply their percent proportion concepts in solving...
Math Drills
Trick-Or-Treat Candy Probabilities
Class members satisfy their sweet tooth with a Halloween-themed, candy probability worksheet. Using images of candy pieces that represent data, young mathematicians find the probability of getting different pieces of candy while...
Curated OER
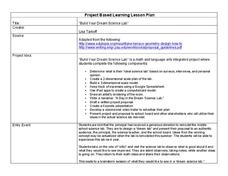
Build Your Dream Science Lab
Would your ideal science lab be filled with bubbling beakers and zapping Tesla coils? Or would it contain state-of-the-art computer technology and data analysis? Dream big with an innovative lesson that connects math and language arts...
EngageNY
Simplifying Square Roots
Explore the process of simplifying square roots through an analysis of perfect squares. The fourth instructional activity of 25 expects individuals to find the perfect square factors in each radicand as a means of simplifying. The...
Curated OER
Measure Mania
Groups of students rotate through five classroom stations to estimate, measure, and record volume, length, weight, mass, and area using both customary and metric measure. They evaluate their data to determine how close their estimates...
EngageNY
Modeling with Polynomials—An Introduction (part 2)
Linear, quadratic, and now cubic functions can model real-life patterns. High schoolers create cubic regression equations to model different scenarios. They then use the regression equations to make predictions.
EngageNY
Modeling a Context from a Verbal Description (part 1)
When complicated algebraic expressions are involved, it is sometimes easier to use a table or graph to model a context. The exercises in this lesson are designed for business applications and require complex algebraic expressions.
EngageNY
Newton’s Law of Cooling, Revisited
Does Newton's Law of Cooling have anything to do with apples? Scholars apply Newton's Law of Cooling to solve problems in the 29th installment of a 35-part module. Now that they have knowledge of logarithms, they can determine the decay...
Noyce Foundation
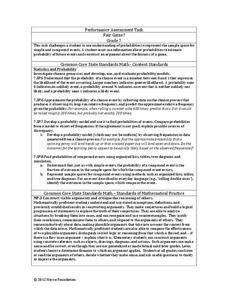
Fair Game?
The game should be fair at all costs. The mini-assessment revolves around the ability to use probabilities to determine whether a game is fair. Individuals determine compound events to calculate simple probabilities and make long-run...
Curated OER
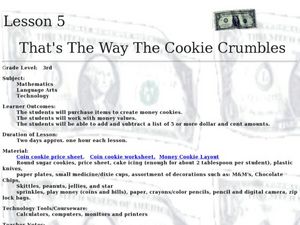
That's The Way the Cookie Crumbles
Third graders work with money values and making purchases. In this money lesson, 3rd graders listen to Donna Guthrie's book, Real World Math: Money and Other Numbers In Your Life. They make money cookies either with a recipe or with...
Curated OER
Review for the Second Exam -
For this probability worksheet, students solve eight math problems involving various scenarios enveloped with the concept of probability. Lastly analyze specific data frequencies to draw a histogram.
Fayetteville-Manlius School
Introduction to Chemistry
Hand your incoming scientists a collection of helpful worksheets to introduce them to your chemistry class. The packet addresses exponents, scientific notation, metric conversion, and dimensional analysis.
Other popular searches
- Data/math Literature
- Analyzing Data in Math
- Math and Data Management
- Math Lesson Data Management
- Task Analysis Math
- Counting Math Task Analysis
- Data Management Math
- Data Handling Math
- Math Data Collecting
- Data Analysis Math
- Math/data Mean Mode Median
- Math Data and Statistics


