DK Publishing
Using the 5 Times Tables, Part 3
Could your third graders use some more practice on the five times table? Six word problems guide pupils through the steps to solve multiplication and division problems with multiples of five. Two examples show them exactly how to use the...
Howard County Schools
Planning for Prom
Make the most of your prom—with math! Pupils write and use a quadratic model to determine the optimal price of prom tickets. After determining the costs associated with the event, learners use a graph to analyze the break even point(s).
Willow Tree
Data Sampling
Some say that you can make statistics say whatever you want. It is important for learners to recognize these biases. Pupils learn about sample bias and the different types of samples.
Curated OER
Tools for Integrating Math and Engineering: Weighin' In
Students collect and analyze data on a fictional cereal company's products. In this measurement lesson, students collect data from cereal boxes (weight, volume, surface area, etc.) to determine if the boxes labels correctly inform...
Curated OER
Chocolate Preferences Voting and Graphing Techniques
Students practice sampling and graphing techniques. In this data collection and interpretation lesson plan, students write and conduct surveys about chocolate preferences and then collect their data. Students graph the data in order to...
Curated OER
Measuring Dispersion
Students compute the standard deviation for a given set of data. For this measuring dispersion lesson, students compute the mean, and then the distance from the mean for each data point. They find the standard deviation of the data.
Pennsylvania Department of Education
Multiplication Represented as Arrays
Third graders collect data about themselves and use in a line plot. In this analyzing data lesson plan, 3rd graders collect various sets of information,create a line plot and compare the data. Students complete a worksheet on their...
Curated OER
Weather Reporter
Fourth graders generate an oral presentation on the weather. In this weather lesson, 4th graders watch the weather for a week and record the data on a chart. Students give a weather report at the end of the week.
Curated OER
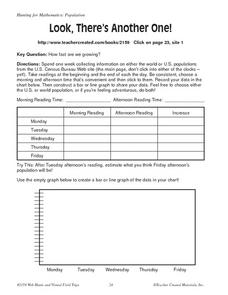
Look, There's Another One!
In this math worksheet, learners spend a week collecting information on either the word or U.S. populations from the U.S. Census Bureau Web site. Students record their data in a chart and bar graph. Learners also use the website to...
Curated OER
Use or Make a Table
In this use or make a table worksheet, learners examine data given in a story problem. They use logic to determine the best way to begin organizing the data and creating a table. This one-page worksheet contains three problems. ...
Curated OER
Calculating Baseball Statistics
Students calculate baseball statistics. In this data analysis lesson, students use baseball statistics to calculate the batting average and slugging percentage. Students visit www.funbrain.com to play a math baseball game.
Curated OER
Aboriginal Statistics
Fourth graders analyze statistics of Native Americans by creating graphs. In this data analysis lesson, 4th graders define different statistical terms and practice finding those statistics from groups of numerical information about...
Curated OER
Measurement and Paper Airplanes
Sixth graders investigate physics by creating paper airplanes. In this flight experiment activity, 6th graders utilize stationary tools to create elaborate paper airplanes which they fly on their school grounds. Students complete...
Curated OER
Storm Alert!
Learners investigate the different types of storms by creating a graphic organizer. In this weather lesson, students analyze data from previous storms while completing a graphic organizer. Learners role-play as though they are weather...
Curated OER
Canada Data Map
Students collect data and analyze it. In this algebra instructional activity, students collect data on the population characteristic in different regions. They use population, culture, settlement and others to help in their criteria.
Curated OER
Data-gathering Activities Relating to Trees in Their Environment
Students gather data relating to trees in their environment. In this biology lesson plan, students determine heights of trees and their ages. A canopy map will indicate optimal growing areas for the tree.
Curated OER
Graphing Information from a Data Table
For this graphing worksheet, students solve 12 problems in which data on a table is presented on a bar graph. This page is intended to be an online activity, but may be completed with paper and pencil.
Curated OER
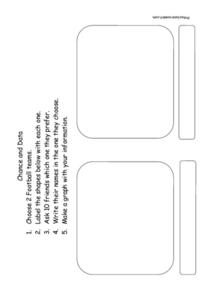
Chance and Data
In this graphing a survey activity, students poll 10 friends to see which of 2 football teams is their favorite and then graph their data results.
Curated OER
Graphing Rainforest Data
In this graphing worksheet, learners graph 2 sets of rainforest data, labeling the horizontal and vertical axis properly and titling each graph.
Curated OER
Fitting a Line to Data
Students work together in groups to collect data in relationship to how much water marbles can displace. After the experiment, they use the data to identify the linear equation to determine the best-fit line. They use the equation to...
Curated OER
Organize Data
In this organizing data worksheet, students complete the tally chart for 'Votes for Team Mascot' and then use the chart to answer the six questions.
Balanced Assessment
Survey Says
Examine statistical data that shows an overlap in responses. The data tallies over 100% and learners interpret this data characteristic. They then create a graph to represent the data.
Curated OER
What Are Your Favorite Apples?
In this tally worksheet, students take a survey to determine the favorite apple. They write tally marks beside the apple chosen. For elementary students, this worksheet may be used for counting purposes and to reinforce what a tally mark...
Math Worksheets Land
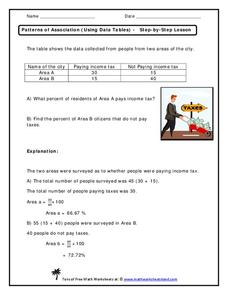
Patterns of Association (Using Data Tables) - Step-by-Step Lesson
This worksheet belongs to a four-part resource that gathers information from data tables to calculate percentages. The page introduces one problem and shares an explanation to the answer.


