Curated OER
Put Your Truss in Building Bridges
Students apply abstract concepts, such as stress, fulcrums, the law of gravity, and the strength of different geometric shapes. Groups of student contractors operate simulated architectural firms to create strong, economical bridges.
Curated OER
Our Favorites
Students participate in and conduct a survey to determine various class favorites. They collect, organize and display their data, interpret the results, and complete a packet of worksheets to display the information.
Curated OER
Data Analysis
Students double check their data collections of Top 20 singles that they've been collecting for several days. Types of data is reviewed in detail and a variety of questions are asked for retention factors of mastery. They draw a tally...
Curated OER
Tables Grids
For this multiplication worksheet, students learn how to fill out a multiplication table or grid. They then fill one out on their own with 36 blank spaces. The answers are on the last page.
Curated OER
Exercise Those Statistics!
Learners participate in various activities, measuring their pulse rates and recording the data. They analyze the statistical concepts of mean, median, mode, and histograms using the data from the cardiovascular activities.
Curated OER
TV Viewing
Pupils test a hypothesis to see if there is a direct correlation between number of hours of TV viewing and academic grade. They collect and compile data to enter on a spreadsheet and create a word processing document supporting their...
Curated OER
Linear Functions
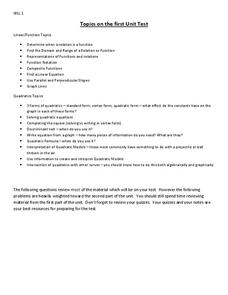
In this algebra learning exercise, students identify and label functions as linear or not. They find the domain and range of each function. There are 15 multiple choice questions.
Curated OER
Data
Students collect data from an experiment they perform. In this data lesson, students use multiple representations to solve practical problems; describe advantages and disadvantages of the use of each representation. Then, they evaluate...
Curated OER
Boxing Up
Middle schoolers explore the relationship between theoretical and experimental probabilities. They use a box model to enter data provided and to randomly draw tickets from the box. Pupils click on any bar in a chart to display the...
Curated OER
Fly Away With Averages
Students study mean, median, and mode. They construct paper airplanes and test them to see how far they fly. They measure the distance and then find the averages of their throws. They use spreadsheet software to record the data in a...
Curated OER
Mean, Median, and Mode
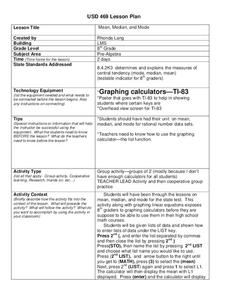
Eighth graders practice using the LIST key on graphing calculators using the proper syntax. They work with the functions of mean, median, and mode in a teacher led activity and then with a partner on a second data set. They follow...
Curated OER
Hibernating Hoopla
Students simulate hibernation with their stuffed animals. They predict the length of time of hibernation and type their math journal entries about sorting, graphing and draw pictures. They read bear hibernation stories.
Curated OER
Discovering a Law of Space Physics
Students use data collected by an astronomer to determine the relationship between the time it takes the planet to orbit the sun and the average radius of the planet's orbit around the sun. Students use trial and error to find the...
Curated OER
Bungee M&M's
Eighth graders experiment with M&M's and a cup attached to a spring to to simulate a bungee jump. They graph the results of the experiment and make predictions for continuing the experiment. They determine the "line of best fit."
Curated OER
Archaeobotany
Students study pictures of seeds and the conditions in which they grow during their study of archaeobotany. They infer ancient plant use by looking at archaeobotanical samples. They determine the change of plant use by interpreting a...
Curated OER
Against all Odds
Tenth graders appreciate the role of probability in understanding everyday situations. They Communicate a summary of financial projections in appropriate reports, tables, and graphs after creating a new game of chance.
Curated OER
Folding Paper
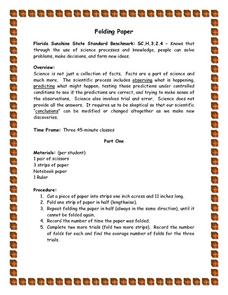
Young scholars use the scientific process and their knowledge to obeserve, predict, and test their predictions under controlled conditions to verify their predictions and then make sense of these predictions. They also graph, write...
Curated OER
Using an Amortization Table
Students search the Internet to find a site that contains an amortization table and make a hypothesis about the results of changing time and rate. They examine the affects of time and rate on a mortgage and discuss the difference in the...
Curated OER
Blowing in the Wind
Students compare hurricanes and tornadoes. They write a paragraph explaining how to prepare for a storm. Students give an oral report. They use weather facts to practice math skills. Students record observations of a storm.
Curated OER
Spinning Nickels
Students make predictions to figure out the probability of a spun nickel landing on either heads or tails. They test their predictions through experimentation. They create a graph showing the frequency for the number of heads.
Curated OER
Teaching Radioactive Decay: Radioactive Half-life And Dating Techniques
Learners generate a radioactive decay table for an imaginary element using a box filled with pinto beans and M&M's. They use their data to plot a decay graph, develop the concept of half-life, and use the graph to "age" several samples.
Curated OER
Billions of Bubbles
Students conduct an experiment with bubbles. In this observation and comparison lesson plan, students read Bubbles, Bubbles, Everywhere and conduct an experiment where they test different kinds of liquids to see which is the best for a...
Alabama Learning Exchange
Effects of Friction on a Moving Block
Students investigate how friction affects the movement of a block across surface areas. They test five different kinds of surfaces—smooth surface, wax paper, a paper towel, course, and fine sandpaper. They predict and record the results...
Curated OER
Maple Syrup
Students explore maple syrup. In this natural resources instructional activity, students identify a maple tree in their neighborhood and observe the sap. Students sample maple products and create a graph of the taste-testing results.


