Mathed Up!
Cumulative Frequency and Box Plots
Learn how to display data. Young data analysts watch a video to review how to create cumulative frequency histograms and box plots. They work on a set of questions to practice producing these data displays.
Noyce Foundation
Parallelogram
Parallelograms are pairs of triangles all the way around. Pupils measure to determine the area and perimeter of a parallelogram. They then find the area of the tirangles formed by drawing a diagonal of the parallelogram and compare their...
Inside Mathematics
Conference Tables
Pupils analyze a pattern of conference tables to determine the number of tables needed and the number of people that can be seated for a given size. Individuals develop general formulas for the two growing number patterns and use them to...
Curated OER
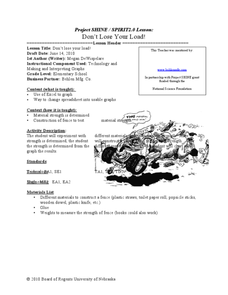
Don't Lose Your Load!
Students create graphs using collected data. In this algebra lesson, students use spreadsheet in Excel to create graphs to interpret their data and make predictions. They rewrite word problems using algebraic expressions.
Curated OER
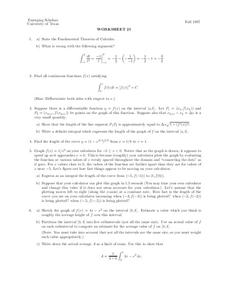
Worksheet 25
In this math worksheet, students state the Fundamental Theorem of Calculus. Then they evaluate the functions and test them against the theorem.
Curated OER
A.P. Calculus Practice Exam AB Version- Section I- Part B
In this A. P. Calculus AB activity, students solve seventeen multiple-choice problems with a graphing calculator. This activity is designed as a practice test for the A.P. Exam and should be timed.
Curated OER
AP Calculus Practice Exam BC Version- Section I -Part B
In this AP Calculus Practice Exam worksheet, students solve seventeen multiple-choice questions using a graphing calculator. This BC practice test is designed to be finished in fifty minutes.
Curated OER
A.P. Calculus Practice Exam BC Version Section I Part B
For this AP Calculus practice test worksheet, students prepare for the BC version on the test by solving seventeen multiple-choice questions using a calculator. The test should be timed and 50 minutes in length.
Curated OER
Will It Sink or Float?
Students perform experiments to see if items will sink or float. For this sink or float lesson, students work in groups to make predictions, and record the results. After the experiments are complete students make a book of the results.
Curated OER
Frequency Tables; Discrete Ungrouped Data
In this frequency tables worksheet, students utilize given data to work out three frequency charts with one containing values and a pie chart involving angles for each value. Students complete three vertical line diagrams and check all...
National Council of Teachers of Mathematics
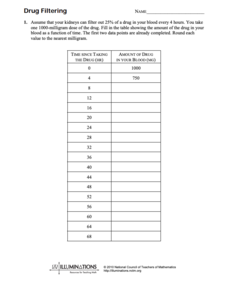
Drug Filtering
In this chemistry instructional activity, learners calculate the amount of drug found in someones blood based on how long they have been taking the drug. There are 5 questions.
Curated OER
Does Weight Affect Drag?
Students investigate how weight affects a parachute's rate of fall. In this investigative activity students test parachutes, average results and conclude what makes a faster descent.
Curated OER
Best Practices
Students are encouraged to do their best on the mile run portion of the fitness test. They also gain knowledge about fitness in other academic areas of the school too. In science, the class records resting pulse rates, in math, charts...
Mathematics Vision Project
Quadratic Equations
Through a variety of physical and theoretical situations, learners are led through the development of some of the deepest concepts in high school mathematics. Complex numbers, the fundamental theorem of algebra and rational exponents...
Curated OER
Bungee M&M's
Science is exciting - and delicious! Pairs of learners set up a bungee cord type of experiment. They use buckets filled with M & M's, a meter stick, and a Slinky spring (as the bungee) to conduct their experiment. A good activity...
Curated OER
Aerospace Engineering
Twelfth graders examine the physics of rocket flight. They build and launch model rockets to measure their performances.
Teach Engineering
Breaking the Mold
A little too much strain could cause a lot of stress. Groups conduct a strength test on clay. Using books as weights, pupils measure the compression of clay columns and calculate the associated strain and stress. Teams record their data...
Curated OER
TE Activity: Bubbling Plants
Students study a way to quantify the process of photosynthesis during a given time using the Elodea plant. They design a hypothesis that they test in the hands on activity. They compare the amounts of photosynthesis that occur during low...
Curated OER
Ball Bounce Experiment
Students investigate different balls' abilities to bounce. They conduct a Ball Bounce Height Comparison and Ball Bounce Time Comparison, complete a worksheet, graph the results of their experiment, and answer investigating questions.
Curated OER
Teaching Reading Comprehension through Social Studies Readings
Examine how immigrants have changed the environment of the United States. Individually, middle schoolers will take a pre- and post-test to assess their reading comprehension. In groups, they compare and contrast the religions of...
Curated OER
Examining The Scores
Learners investigate test scores taken to obtain academic strengths and weaknesses. They practice looking at the scores in order to interpret the results. Students use time for class discussion and planning study strategies to target...
Curated OER
Data Collection Project
Young scholars collect data using email. They calculate the mean, median, mode, range and outliers. They create a graph using the data results. They write five paragraphs to summarize their data.
Curated OER
Apples Galore! (Elementary, Language)
Fifth graders examine and taste 7-8 difference apples, describe the flavor/texture, then graph the results of favorites. Finally students write a paragraph describing their favorite.
Curated OER
Tony's Spelling Troubles
Students are introduced to the given problem and describe in their own words the situation represented in a bar chart and tally chart. They then use a bar chart and tally chart to make sensible predictions.


