Curated OER
The Ups and Downs of Ozone
Learners use data from tables to draw graphs. They interpret the graphed data and explain how CFCs damage the ozone layer. This is a good cross-curricular instructional activity.
Curated OER
Identifying Ozone Variations over Different Locations
Learners analyze ozone data. In this atmosphere lesson, students will use a NASA resource to gather data for different regions of the Earth. Learners will then create a graph for their data and answer related questions.
Curated OER
Ozone Hole Activity
In this Ozone worksheet, students graph ozone readings from 1956 to 1996. They predict what the Ozone layer will look like in 2010 and 2050. They answer questions about the Ozone and its purpose.
Polar Trec
Ozone Data Comparison over the South Pole
Did you know the hole in the ozone is seasonal and filled by January every year? The lesson uses scientific measurements of the ozone over the South Pole to understand patterns. Scholars learn that the hole grew bigger annually before...
Science Geek
Earth's Atmosphere
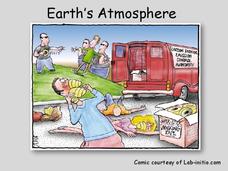
Ozone gas absorbs the harmful UV-B rays and helps protect humans. An informative presentation begins with the layers of the earth's atmosphere, the pressure and temperature in each of the layers, the ozone layer, the ozone cycle, and the...
Curated OER
Data Analysis of Ground Level Ozone
Sixth graders construct and interpret graphs from ozone data collected in Phoenix area. Can be adapted to other areas.
Curated OER
Ozone: The Earth's Security Blanket
Students work in groups to define and research the terms: ozone, troposphere and stratosphere. Students watch videos, conduct Internet research, participate in discussion groups and complete worksheets.
Curated OER
DATA ANALYSIS OF GROUND LEVEL OZONE
Sixth graders construct and interpret graphs from ozone data collected in the Phoenix area.
Curated OER
Teaching About the Ozone Hole
A PowerPoint and an accompanying worksheet introduce young meteorologists to the hole in the ozone layer. Another handout provides a coloring and graphing activity which examines the changes in the ozone. There are also links to neat...
Texas State Energy Conservation Office
Investigation: Blowing in the Wind
Using a simulated air sample, environmental or earth science pupils examine the components. You will need to prepare the faux air by using a hole punch and various colors of construction paper. Each color will represent a different...
Columbus City Schools
What is Up Th-air? — Atmosphere
Air, air, everywhere, but what's in it, and what makes Earth's air so unique and special? Journey through the layers above us to uncover our atmosphere's composition and how it works to make life possible below. Pupils conduct research...
Curated OER
Graphing Ozone Chemistry: Introduction
Students discuss Ozone Chemistry. They do research on the subject. They graph their data. They analyze the economic impact of removing CFC's from the biosphere, and graph the worldwide production of CFC's since their discovery.
Curated OER
Ground Level Ozone
Students analyze real-time data and predict the level of ground ozone in their home city. They measure the level of ground ozone, submit their data to an online collaborative project, and create a web page presenting the dangers of...
Curated OER
Linkages Between Surface Temperature And Tropospheric Ozone
Students collect and interpret data to make predictions about the levels of ozone in the atmosphere. Using the internet to collect data students use their collected data to create a line graph for analysis. Students make mathematical...
Curated OER
Ozone and Temperature Data Analysis, South Pole Antarctica
Young scholars discuss the layers of the atmosphere, and the history of the ozone hole. They discuss the chemistry of the ozone formation. Students compare seasonal data collected with ozonesondes. They compare Antarctic and Arctic ozone...
Curated OER
Environment: Battling for Oxygen
Students construct an interactive ozone depletion model using gumdrops and toothpicks. After analyzing the data obtained from the model, they record it on butcher paper and complete worksheets about oxygen.
Curated OER
Air Pollution:What's the Solution?-Weather's Role
In this air pollution and weather worksheet, students collect data using an online animation to determine the air quality at given times along with the wind speed and temperature in a particular city. Students make 3 bar graphs using the...
Curated OER
Energy Worksheet #1
A graph of Earth's average monthly temperatures from 1990 to 1994 is posted across the top of the page for meteorology masters to analyze. Five multiple choice questions are asked regarding temperature variation. This does not have to be...
Curated OER
Ozone
Students locate the ozone layer of the atmosphere. They explain natural formation of ozone. They list chemicals that react with ozone. They explain how CFC's destroy ozone.
Curated OER
Tracking Ozone
Students track an ozone event in Groton, CT. They compare weather changes and the subsequent ozone levels. Also, they make comparisons and determinations about ozone levels.
Curated OER
Trouble in the Troposphere
Students Use data sets from MY NASA DATA to produce graphs comparing monthly and yearly ozone averages of several U.S. cities. They analyze and evaluate the data and predict trends based on the data. In addition, they discuss and...
Curated OER
Effects of Ozone in the Air
Fifth graders learn how ground-level ozone is an air pollution problem. Students measure ozone levels and graph the results.
Curated OER
Creating and Analyzing Graphs of Tropospheric Ozone
Students create and analyze graphs using archived atmospheric data to compare the ozone levels of selected regions around the world.
Curated OER
The Breathtaking Nature of the Urban Explosion, Part 2
Young scholars explore ozone levels. They measure the concentrations of ground-level ozone in the atmosphere. Students observe changes in the concentrations of ozone over time. Young scholars complete a data sheet to record ozone...


