Curated OER
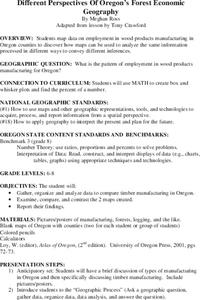
Different Perspectives of Oregon's Forest Economic Geography
Students locate the many forests located in Oregon. In groups, they use the internet to research employment data on wood products made in the state. They discuss how looking at information presented in a different way can change their...
Curated OER
Chaos
Students experiment with several chaotic simulation, they build a working definition of chaos. Students reinforce their knowledge of basic probability and percents. They are reminded of previous knowledge that is pertinent to this...
Curated OER
Transformations
Tenth graders recognize, perform and derive rules for basic transformations including translation, reflection and rotation. They also consider compositions, a combination of two or more basic transformations. Students explore both...
Curated OER
Teaching the Toki Kaku Dako
Students complete various readings and decorating, constructing, and flying a kite. They analyze how the parts of a system to together. Students comprehend the concept of area.
Curated OER
Surface Area and Volume of a Cube
Students explore finding the surface area and volume of cubes and cylinders. They construct similar three-dimensional figures from a two-dimensional drawing. Students derive the formula for volume and surface area through examination...
Alabama Learning Exchange
Writing Word Equations
Young scholars explore the concept of chemical formulas. In this chemical formula lesson plan, students watch a video about balancing chemical equations. Young scholars conduct an experiment using silver nitrate and sodium phosphate. ...
Curated OER
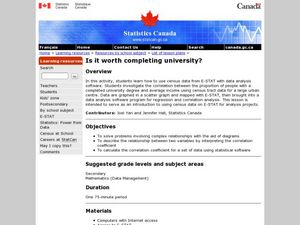
Completing University
Students analyze the pros and cons of completing a 4 year school. In this statistics lesson, students complete surveys and use E-STAT to graph their data. They learn to plot and build diagrams.
Other popular searches
- Solving Proportions Using X
- Algebra Solving Proportions
- Math Solving Proportions
- Math, Solving Proportions
- Proportions Problem Solving


