Mathed Up!
Stem and Leaf Diagrams
Order the data within a stem-and-leaf display. Pupils take data and create and ordered stem-and-leaf diagrams, including the key. Participants take their data and determine answers about the information. Class members then find...
Willow Tree
Box-and-Whisker Plots
Whiskers are not just for cats! Pupils create box-and-whisker plots from given data sets. They analyze the data using the graphs as their guide.
Alpena-Montmorency-Alcona Educational Service District
4th Grade Personal Narrative
Throughout 10 lessons, fourth graders learn how to plan, organize, write, and edit their own personal narratives. In the beginning, young writers come up with ideas of personal experiences and the emotions linked with those experiences....
California Education Partners
Lashelles Garden
Let knowledge grow bountifully like plants in a garden. Given a diagram of a rectangular garden split into plots, scholars determine the area of the entire garden and the areas of the individual plots. As a culminating activity, they...
Newspaper Association of America
Celebrating Women’s History Month
Examine the lives of four women—Blanche Stuart Scott, Madeleine L'Engle, Margaret Evans Price, and Sybil Ludington—in a 23-page activity packet. Each profile comes with a set of vocabulary and reading comprehension questions. Further...
CCSS Math Activities
Smarter Balanced Sample Items: High School Math – Target P
Learn how to show data in varied ways. A PowerPoint presentation provides six questions from the high school SBAC Claim 1 Target P item specifications. It covers creating data representations, interpreting and comparing data, and...
Mathematics Assessment Project
Middle School Mathematics Test 3
Real-life mathematics is not as simple as repeating a set of steps; pupils must mentally go through a process to come to their conclusions. Teach learners to read, analyze, and create a plan for solving a problem situation. The...
Houghton Mifflin Harcourt
Unit 8 Math Vocabulary Cards (Grade 4)
Enhance fourth graders' math vocabulary with 17 word cards and their definitions. Learners focus on terms that deal with graphing, such as y-axis, coordinates, plot, and ordered pair in the last set of math vocabulary cards.
Curated OER
Statistical Inquiry
In this statistical inquiry worksheet, students analyze and interpret a variety of diagrams such as a scatter plot, bar graph and pie charts. They create tables and other diagrams to support given data. This two-page worksheet contains 3...
Curated OER
Data Handling
In this data handling worksheet, students explore multiple ways to represent data. They create stem and leaf plots, histograms, and bar charts. Students examine and interpret diagrams and statistics. This eleven-page...
Curated OER
The Effect of Dissolved Salt on the Boiling Point of Water
Explore the properties of solutions with a lab activity. Chemistry fans determine the boiling point of water, add salt to create a solution, and then repeat the process four more times. They design their own data table and then graph the...
Los Angeles County Office of Education
Assessment For The California Mathematics Standards Grade 6
Test your scholars' knowledge of a multitude of concepts with an assessment aligned to the California math standards. Using the exam, class members show what they know about the four operations, positive and negative numbers, statistics...
Curated OER
Investigating Force, Acceleration and Velocity
In this Investigating force, acceleration and velocity instructional activity, students read story problems involving constant velocity and acceleration, create a diagram of the problem, and consider the forces acting upon the item...
Curated OER
Make a Frequency Table and a Histogram for a Given Set of Data
In this data recording and data organization worksheet, students create one frequency table and one histogram for a given list of data. Explanations and examples for frequency tables and histograms are given.
Rice University
Introductory Statistics
Statistically speaking, the content covers several grades. Featuring all of the statistics typically covered in a college-level Statistics course, the expansive content spans from sixth grade on up to high school. Material...
Curated OER
Straight Line Graphs
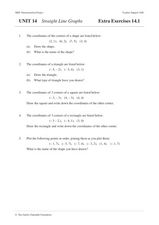
In this algebra worksheet, students graph coordinate pairs on a coordinate plane. They match points with letters and graph a line through all the plotting to create a straight line. There are 25 questions with an answer key.
Curated OER
A Simple Model for Atmospheric Carbon Dioxide
In this atmospheric carbon dioxide activity, students use two diagrams to solve 6 problems about atmospheric carbon dioxide. One diagram shows the Keeling Curve and the other shows sources of carbon and the natural and anthropogenic...
Curated OER
Cartesian Geometry
In this geometry activity, learners plot coordinate pairs and connect the points to create different shapes. They give th shapes its polygon's name. They differentiate between simple functions and rectangular hyperbola.
Miami University
Chapter Nine Worksheet: Monopoly
Advanced economics pupils analyze a series of graphs, data sets, and profit scenarios all related to monopolies and marginal revenue. They read through the background information, complete a graph using the data provided, and justify...
Curated OER
Tuesdays with Morrie Pages 44-61
In this Tuesdays with Morrie instructional activity, learners answer three questions and complete one Venn Diagram to help analyze the characters and plot of the text more thoughtfully.
Curated OER
Project Interactive--Stem and Leaf Plotter
In this excellent stem and leaf plotter worksheet, students construct, arrange and write a report of how to interpret the leaves they collect in this data analysis. Students answer 4 detailed questions regarding the data analysis...
Curated OER
St. Augustine's Confessions by St. Augustine
In this online interactive reading comprehension worksheet, students respond to 10 short answer and essay questions based on St. Augustine's Confessions. Students may also access an online quiz on the selection using the link at the...


