New York State Education Department
TASC Transition Curriculum: Workshop 3
Teachers turning into students? It's not Freaky Friday! It's a thoughtful workshop that teaches participants how to plan professional development for staff. Third in a 15-part series, the workshop provides a platform for the other...
New York State Education Department
TASC Transition Curriculum: Workshop 4
Why is it important to use precise language? Participants explore this question in the fourth activity in a series of 15 on effective instruction. Perfect for all content areas, the activity promotes appropriate language choice through...
Utah Education Network
Uen: Generating and Recording Data
This "fish" activity will help early elementary students develop skills related to categorizing, recording data, developing vocabulary, and counting. An assessment rubric is attached.
Other
U. Of Wisconsin: Formulating Statistical Questions and Collecting Data
This slideshow gives a detailed explanation of the characteristics of statistical questions and how they differ from other types of questions, the types of studies, and the methods for collecting data. It describes the case of Clever...
REMC Association of Michigan
Remc Association of Michigan: 21 Things4 Students: 13. Dig the Data
This tutorial contains ten quests. You will learn to create spreadsheets and charts, use formulas, and make decisions based on data. The first five quests has students plan a party and in the last five, they collect and analyze data for...
Discovery Education
Discovery Education: Science Fair Central: Investigation Set Up and Collect Data
A brief overview of how to gather both quantitative and qualitative data, complete with a sample data table.
CK-12 Foundation
Ck 12: Measurement and Recording Data
[Free Registration/Login may be required to access all resource tools.] In this tutorial, students will learn about measurement, significant digits, and their use in scientific notation.
Louisiana Department of Education
Louisiana Doe: Louisiana Believes: Eureka Math Parent Guide: Collecting and Displaying Data
A guide to support parents as they work with their students in collecting and displaying data.
Science Education Resource Center at Carleton College
Serc: Hot Wheelin' With Speed, Acceleration, and Data Graphs
In this lab, students investigate the motion of toy cars and collect data to analyze the speed of the vehicle between various points and overall speed.
Stanford University
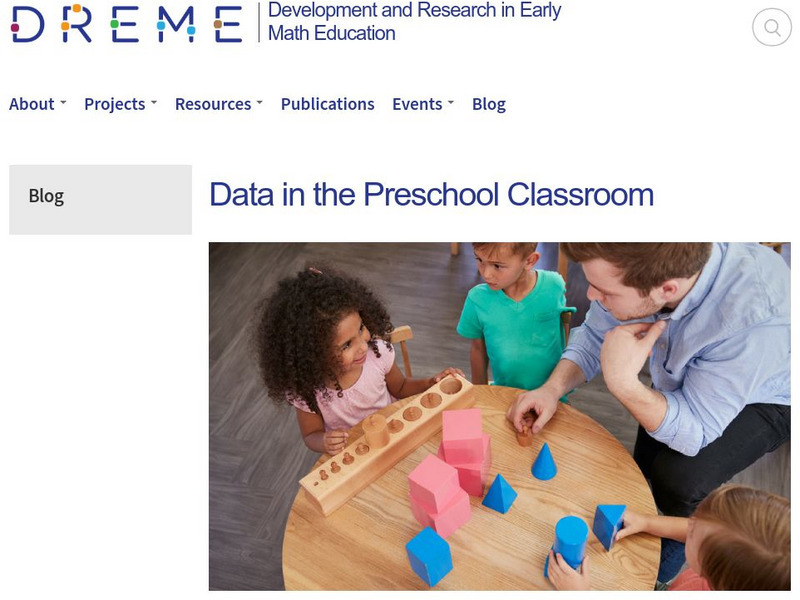
Dreme: Data in the Preschool Classroom
What are the important concepts involved in data collection and data use in the preschool classroom, and how can teachers support the mathematics of data? This article gives a brief description of the concepts that children need to grasp...
Texas Education Agency
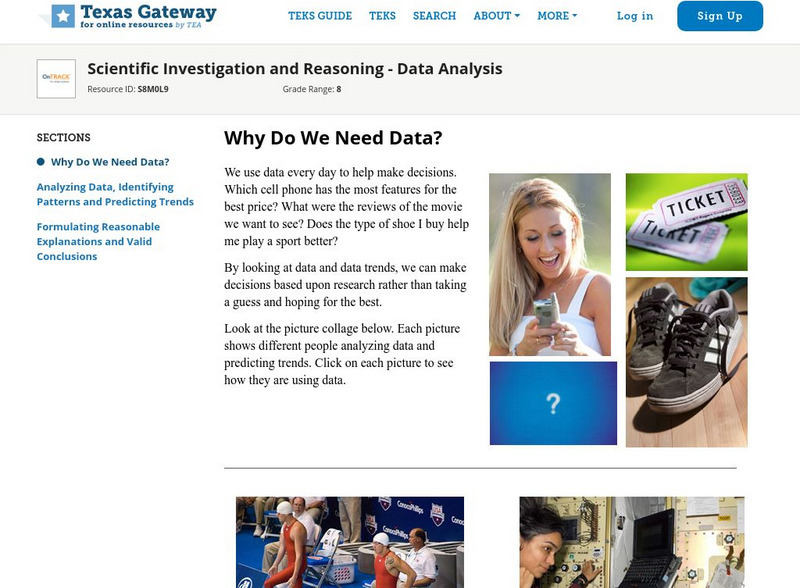
Texas Gateway: Why Do We Need Data?
We use data every day to help make decisions. Which cell phone has the most features for the best price? What were the reviews of the movie we want to see? Does the type of shoe I buy help me play a sport better?By looking at data and...
Oswego City School District
Regents Exam Prep Center: Practice With Organizing and Interpreting Data
Several problems are presented to test your skills in creating and interpreting frequency tables, pie charts, box-and-whisker and stem-and-leaf plots.
Childnet
Childnet: Online Safety: Privacy and Data
Privacy is the ability to keep certain things to yourself, for them not to be seen by or shared with others. Personal data is information about you collected by the apps and websites you visit (like the things you like and open). This...
Science Education Resource Center at Carleton College
Serc: Determining Bulk Density of Different Soil Samples and Data Analysis
A field based lab experiment where young scholars work in groups to come up with a collection strategy and lab analysis to test differences in soil bulk densities. Students bring soil samples back to the classroom to conduct a test that...
NOAA
Noaa: Weather and Atmosphere
The collections in this thematic area provide educational resources that introduce concepts of weather and atmosphere. It provides activities and data for exploring weather and atmospheric sciences, and link to emerging research on these...
PBS
Pbs Learning Media: Daily and Seasonal Weather: Interactive Lesson
Students investigate the relationship between daily weather and seasonal weather. Students will read about how weather data is collected, then interpret examples of weekly and monthly weather data to find seasonal patterns. Visual...
NASA
Nasa: Precipitation Towers: Modeling Weather Data
This lesson uses stacking cubes as a way to graph precipitation data, comparing the precipitation averages and seasonal patterns for several locations. Variations on the lesson can accommodate various ages and ability levels. Learners...
PBS
Pbs Kids Afterschool Adventure!: Operation: Data Saves the Day Activity Plan
Data comes to the rescue! Children will collect, analyze, and represent data as they try to dodge a series of catastrophes faced by characters from their favorite PBS Kids shows.
Vision Learning
Visionlearning: Data: Data Analysis and Interpretation
An explanation of data from collection to analysis. Includes a discussion of how the same data may be interpreted various ways by different individuals.
Vision Learning
Visionlearning: Data: Uncertainty, Error, and Confidence
An explanation of how errors may affect data that has been collected for experimentation. Some examples are given.
Google
Google for Education: Data Aggregation and Decomposition (Python)
Students learn how to use and analyze data to draw conclusions about information collected from classmates. Then they use computational thinking by collecting and aggregating data onto a spreadsheet, identifying patterns in their data,...
Smithsonian Institution
Smithsonian Learning Lab: Prehistoric Climate Change and Why It Matters Today
In a instructional activity in this issue of Smithsonian in Your Classroom, students do the work of a team of paleontologists studying a time of rising carbon dioxide and rapid global warming during the Eocene epoch. By examining fossils...
Other
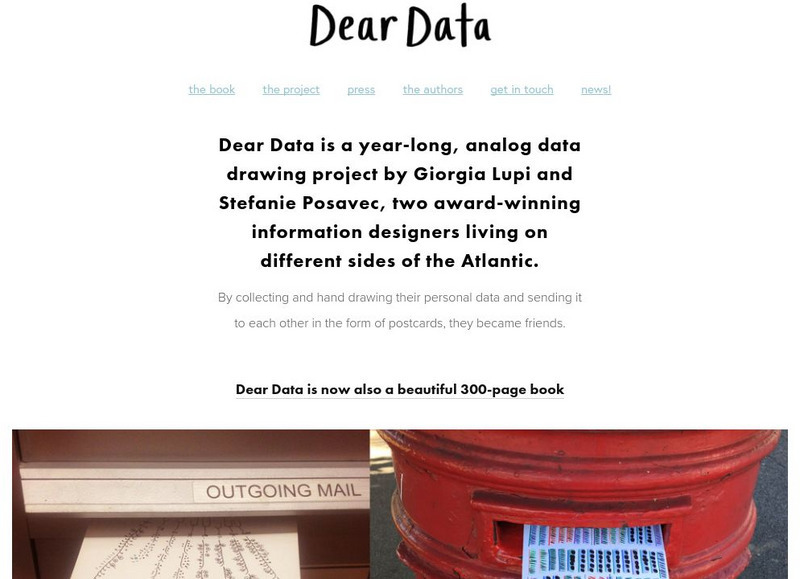
Dear Data
Dear Data is a year-long, analog data drawing project by Giorgia Lupi and Stefanie Posavec, two award-winning information designers living on different sides of the Atlantic. By collecting and hand drawing their personal data and sending...
Vision Learning
Visionlearning: Data: Using Graphs and Visual Data in Science
An explanation of how data can be turned into visual forms which can help people comprehend information easier than observing numbers.


