Sophia Learning
Sophia: Creating a Good Survey and Analyzing the Results
In this activity, students will learn how to develop a sample survey while also using inferential statistics to solve real-world problems.
Science Education Resource Center at Carleton College
Serc: Investigating Contour Maps: Creating Contour Maps by Surveying
In this activity, the students will understand how contour maps are created and appear the way that they do by using various materials to create and compare contour lines of different elevation levels.
Google
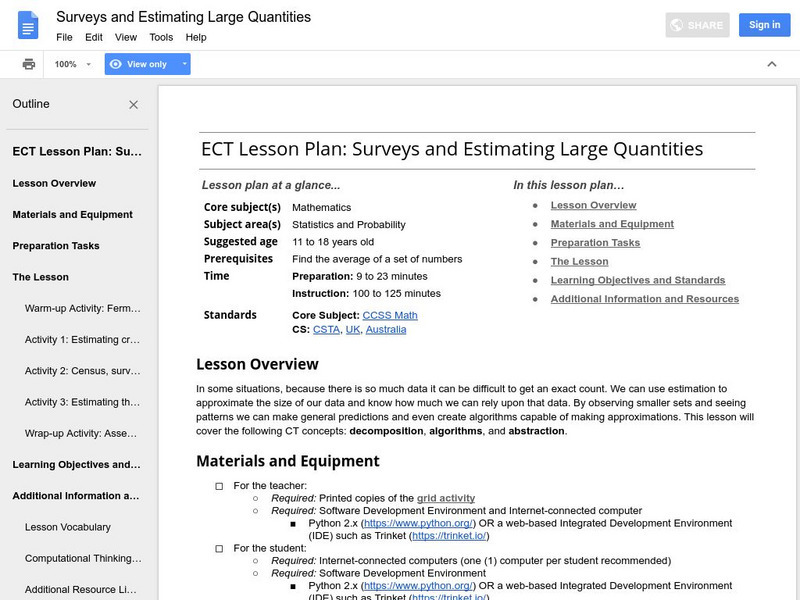
Google for Education: Surveys and Estimating Large Quantities
Young scholars use estimation to approximate the size of a large set of data. By observing smaller sets and seeing patterns they make general predictions and even create algorithms capable of making approximations.
Better Lesson
Better Lesson: Class Surveys and Graphs
Learners love graphing data that they "own". In this plan, the class will select a type of graph and create it using a class survey frequency table. Included in this activity are videos of the class engaged in the activity and samples of...
Better Lesson
Better Lesson: 100 Students Project: Revising Questions & Planning the Survey
How can the wording of a question influence how people respond? Students learn about biased and unbiased questions, revise the questions they create in the previous lesson, and agree on procedures for administering the survey.
Better Lesson
Better Lesson: Survey Skills: Assessment
Today we become Gallup Poll central as students take a set of collected data and create a visual representation using the skills that have been taught over the past few lessons.
Better Lesson
Better Lesson: Hilarious Histograms. Analyzing and Creating
The students will be using real life data to create and analyze histograms. They will be surveying their classmates and using data from other grade levels to compare same topic information in a histogram.
Alabama Learning Exchange
Alex: Great Golly Graphs
This lesson plan asks learners to create a survey project including graphs, questions, tables, and data analysis. It gives an assessment and ideas for remediation and extension as well as ways to manage behavior problems and reluctant...
EL Education
El Education: Local Habitat Survey and Animal Research
Students observe animals in several habitats and then choose one animal to research. Students learn about physical adaptations that help each animal live successfully in its habitat and then draw a picture of their animal which is later...
Other
Laus Dnet: Grade 5 Excel Lesson Plan
In this online instructional activity, students will survey students in their school to determine their favorite type of hand-held ice cream. Before performing the survey, students will make predictions about which ice creams they think...
Other
Brookfield High School: Lesnansky's Control Center: Would You Rather? (Part 2)
In this activity, students will create a customized Google Form that will showcase the four dilemmas defined by the game cards from Would You Rather...? and then share the form with others to collect data for analysis. Lots of Would You...
Alabama Learning Exchange
Alex: Ice Cream Sundae Survey
Learners quickly realize the importance of learning how to read and find information in charts, graphs, and tables compared to finding the same information written in a paragraph. This is a fun, high energy lesson!This lesson plan was...
Constitutional Rights Foundation
Constitutional Rights Foundation: St. Thomas Aquinas, Natural Law, and the Common Good
Learning activity in which students survey the philosophy of St. Thomas Aquinas and his ideas on government, natural law, and the common good to create policies or programs the U.S. government could enact. Questions for discussion and...
Indiana University
Indiana University Bloomington: Foldable Fault Blocks [Pdf]
In this lesson, students will create three-dimensional (3-D) blocks out of paper to learn about the types of faulting that occur at the Earth's surface and its interior. Students will manipulate three fault blocks to demonstrate a normal...
Alabama Learning Exchange
Alex: Getting to Know Your Classmates Using Bar Graphs
Middle schoolers will collect data from class using surveys. Students survey classmates concerning favorite movies, favorite color, shoe size, time spent studying, brand of cell phone and etc. From the data they will create bar graphs...
Other
Doodle.com
Doodle is a web-based application that makes it easy for us to create an online survey. This is a great tool whether you are trying to find a suitable date for coordinating appointments or doing a classroom activity with some live,...
The Franklin Institute
Frankin Institute Online: Group Graphing
This site from The Franklin Institute explores how to make a simple graph using a spreadsheet to portray survey data. It also gives a set of interesting sports-related web sites so that students can get statistical inforamtion.
EL Education
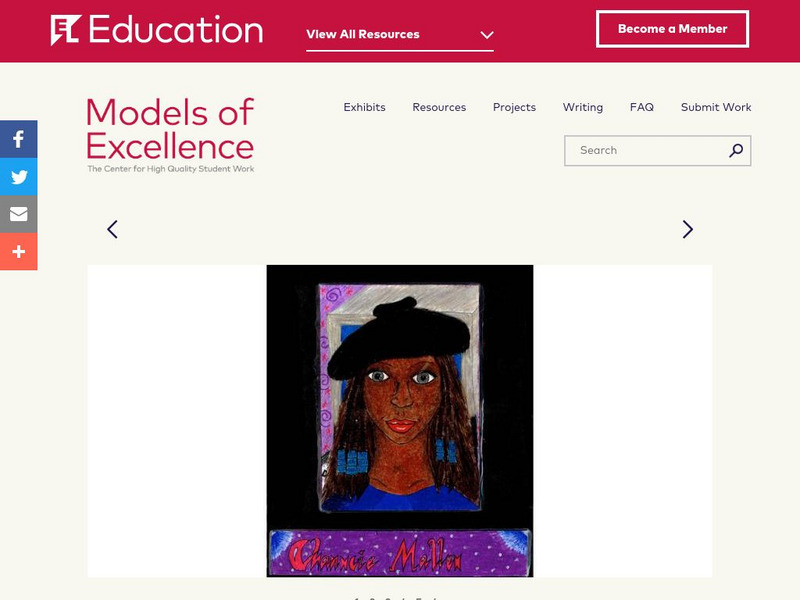
El Education: Chauncie Mallen
A 5th/6th grade student in Shutesbury, Massachusetts, created this character file (CF) as part of a Learning expedition on local scientists. As part of the expedition, students surveyed all of the fields that are considered the hard...
US Census Bureau
Us Census: Percentage of People Who Walk to Work in Cities and Population Size
Using census data, learners will create box plots to make inferences about the percentages of people who walk to work in cities of different population sizes (small, medium, and large). Students will use these findings to write a short...
EL Education
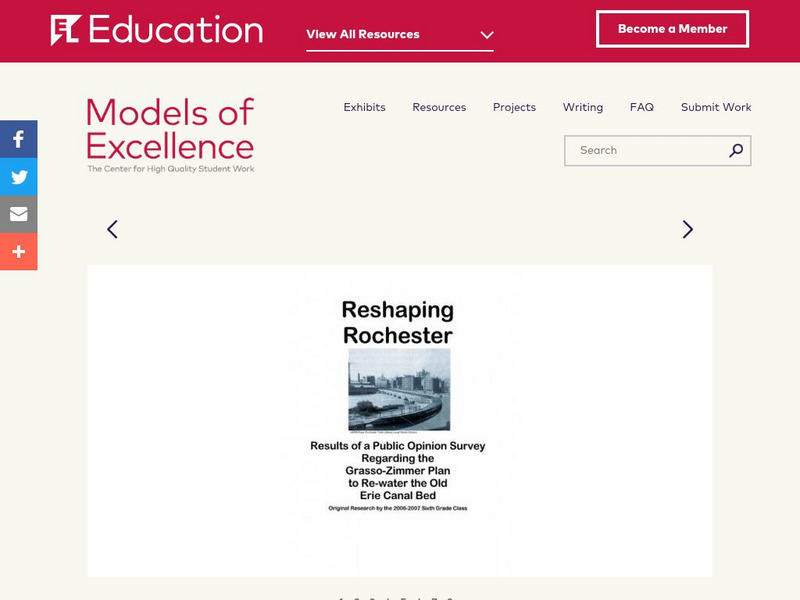
El Education: Reshaping Rochester
After learning about the effects of re-watering a dry water way in their city, students realize that public support would be needed for such an undertaking. In order to determine public support, students design and implement a survey,...
Rice University
Rice University: The Hand Squeeze
Students will enjoy this data collection and class analysis experiment involving the time it takes for a hand squeeze to travel around a circle of people. From organizing the activity to collecting the data to making a table and graphing...
US Department of Education
National Center for Education Statistics: Nces Classroom
Just what is the NCES Students' Classroom? In addition to many useful features, this site provides math and statistical activities tailored to a middle and elementary school students.
TeachEngineering
Teach Engineering: Environment
Through 10 lessons and more than 20 hands-on activities, students are introduced to the concept of an environment and the many interactions within it. As they learn about natural and human-made environments, as well as renewable and...
TeachEngineering
Teach Engineering: Can You Catch the Water?
Students construct a three-dimensional model of a water catchment basin using everyday objects to create hills, mountains, valleys and water sources. They experiment to see where rain travels and collects, and survey water pathways to...


