New York State Education Department
TASC Transition Curriculum: Workshop 3
Teachers turning into learners? It's not Freaky Friday! It's a thoughtful workshop that teaches participants how to plan professional development for staff. Third in a 15-part series, the workshop provides a platform for the other...
New York State Education Department
TASC Transition Curriculum: Workshop 4
Why is it important to use precise language? Participants explore this question in the fourth activity in a series of 15 on effective instruction. Perfect for all content areas, the activity promotes appropriate language choice through...
Center for Innovation in Engineering and Science Education, Stevens Institute of Technology
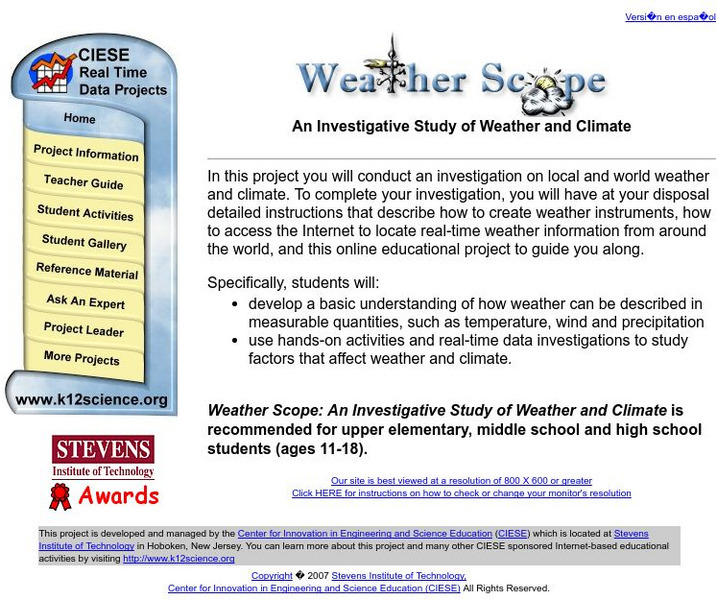
Ciese Real Time Data Projects: Weather Scope: A Study of Weather and Climate
Use real-time data to study factors that affect weather and climate, create weather instruments, and share data with students around the world.
Center for Innovation in Engineering and Science Education, Stevens Institute of Technology
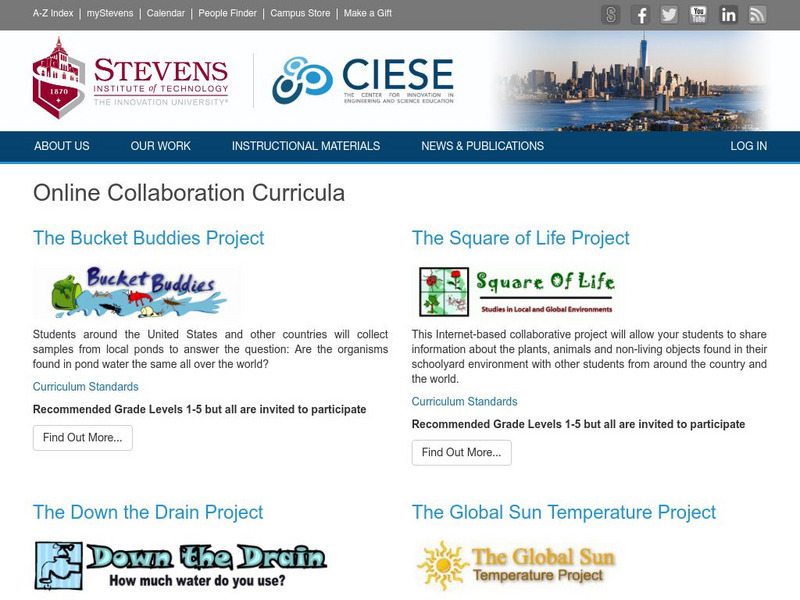
Ciese: Collaborative Projects
Using a variety of science topics, these projects link your class with classes around the world in data collection and analysis. There are projects recommended for all grade levels. Begin dates and end dates are listed to help in...
Center for Innovation in Engineering and Science Education, Stevens Institute of Technology
Ciese: Human Genetics Project: Is the Dominant Trait Most Prevalent?
Human-Genetics: A Worldwide Search for the Dominant Trait allows you to collect data and share your results with students around the world. Register your class, complete the student survey, participate in discussion boards, and interact...
Center for Innovation in Engineering and Science Education, Stevens Institute of Technology
Ciese Real Time Data Projects: The Stowaway Adventure
Through this series of Internet-based learning experiences and activities, students will use real-time data to track a real ship at sea and monitor weather conditions. Includes a teacher's guide with problem-solving lesson plans...
Other
A River Runs Through It Learning Project
In this year long learning project integrating mathematics and science, students solve environmental problems using data collection and problem solving concepts. Designed for upper elementary gifted students. Interactive components and...
National Council of Teachers of Mathematics
The Math Forum: Data Collecting Project Stats Class
This lesson plan provides the teacher with all the necessary handouts and directions to give a statistics class when they are ready to complete a thorough survey project. Broken into five parts, it takes the students through the...
Center for Innovation in Engineering and Science Education, Stevens Institute of Technology
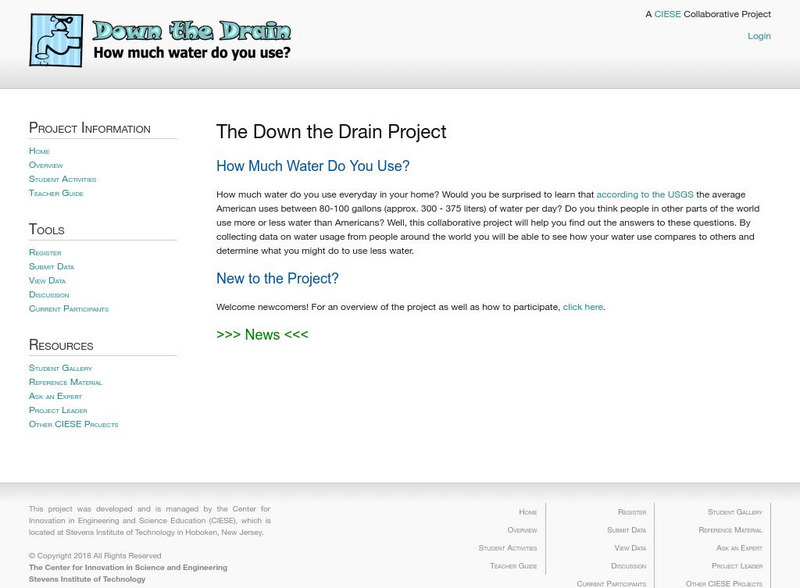
Ciese: Down the Drain Project
Teachers can start this project at any time and no registration is required. Students collect data about water usage for themselves, their homes and their class. They analyze it, make predictions about it, and submit the data to the...
Other
Global Grocery List Project: Homepage
At this site from the Global Grocery List Project, students collect data on the prices of common grocery items and submit their findings. They can then compare the data they collected to data from students around the world. There are...
Discovery Education
Discovery Education: Science Fair Central: Investigation Set Up and Collect Data
A brief overview of how to gather both quantitative and qualitative data, complete with a sample data table.
Center for Innovation in Engineering and Science Education, Stevens Institute of Technology
Ciese Collaborative Projects: International Boiling Point Project
An Internet project designed to determine the greatest influence on the boiling point. After reading the project instructions and performing the experiment, submit your data and compare your results to other classes from around the world.
Science Buddies
Science Buddies: Interpreting Area Data From Maps vs. Graphs
Graphical methods of data presentation are a key feature of scientific communication. This project asks the question, "What's the best way to compare the land area of states: a map or a bar graph?" You'll be measuring performance on two...
University Corporation for Atmospheric Research
Ucar: Project Sky Math
Teachers will be interested to explore the SkyMath module, and the 16 classroom activities at this site. In this program, students will collect and record real-time weather data to analyze. Data analysis, graphing, number relationship,...
National Council of Teachers of Mathematics
The Math Forum: Seventh Grade Mathematics: Data Sense
This site has some interesting ways to collect and evaluate data. There are some activities about note taking, spreadsheets, surveys, and a cool bridge construction project. Teachers may want to use this site as a resource for some...
National Center for Ecological Analysis and Synthesis, University of California Santa Barbara
Kids Do Ecology: Data and Science
Learn about conducting your own investigation with these tips on following the scientific method. Find out how to state hypothesis, make observations, collect and analyze data, and display data to share results and conclusions of your...
Center for Innovation in Engineering and Science Education, Stevens Institute of Technology
Ciese Collaborative Projects: Down the Drain: How Much Water Do You Use?
How much water do you use everyday? Find out in this engaging investigation, where you compare your water usage with your classmates and other people around the world. An exploration filled with lots of math and science that students are...
Center for Innovation in Engineering and Science Education, Stevens Institute of Technology
Ciese Real Time Data Projects:collecting Weather Data and Keeping a Weather Log
Over a period of two weeks students will use their class-made instruments to measure and record weather data. Students will also compare their data to online weather data. The final activity involves analyzing the collected data to look...
University Corporation for Atmospheric Research
Ucar: Field Projects: Science in Action
In this activity, students gather information about atmospheric scientific field projects in order to understand how a research question about the Earth system can be answered by collecting data using many different research platforms...
TeachEngineering
Teach Engineering: Storing Android Accelerometer Data: App Design
Students work through an online tutorial on MIT's App Inventor to learn how to create Android applications. Using those skills, they create their own applications and use them to collect data from an Android device accelerometer and...
Other
Dear Data
Dear Data is a year-long, analog data drawing project by Giorgia Lupi and Stefanie Posavec, two award-winning information designers living on different sides of the Atlantic. By collecting and hand drawing their personal data and sending...
Center for Innovation in Engineering and Science Education, Stevens Institute of Technology
Ciese Collaborative Projects: Down the Drain: How Much Water Do You Use?
Meet another classroom and study how much water your class uses compared to another class that may be in another part of the world. Through a variety of activities and gather data be able to collaborate with others via the internet to...
Alabama Learning Exchange
Alex: Qualitative Analysis Project
Young scholars, working in groups, will identify four unknown substances using analysis procedures practiced in the lab throughout the school year. They will collect data, research the unknown substances, and report findings in a...
Utah Education Network
Uen: Dissolving Sugar Class Science Fair Project
Second graders work together as a class to generate a science fair project.

