National Humanities Center
Teaching The Great Gatsby: A Common Core Close Reading Seminar
The 41 slides in a professional development seminar model how to use close reading techniques to examine the many layers of F. Scott Fitzgerald's The Great Gatsby. In addition to passages from the novel, slides provide biographical...
EngageNY
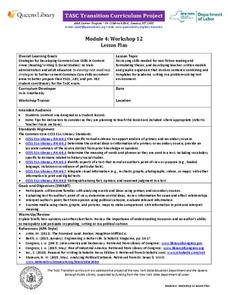
TASC Transition Curriculum: Workshop 12
How can opinions slant facts? Workshop participants learn how to examine primary and secondary sources and identify the author's point of view. They also examine how visual art impacts the meaning and rhetoric of sources. Full of...
Better Lesson
Better Lesson: Something's Fishy Working With Bar Graphs
In this lesson plan, students continue to build their graphing skills. This lesson plan also reinforces important mathematical skills like counting and comparing.
Better Lesson
Better Lesson: Fast Food Freddie Surveys and Bar Graphs
Students continue to build their graphing skills. They experience a real world application of graphing by organizing survey results.
Fun Brain
Fun Brain: What's the Point? (Graphing Skills Game)
This graphing game challenges players to supply the coordinates for points shown on a series of graphs and also to plot pairs of coordinates on simple Cartesian planes.
Utah Education Network
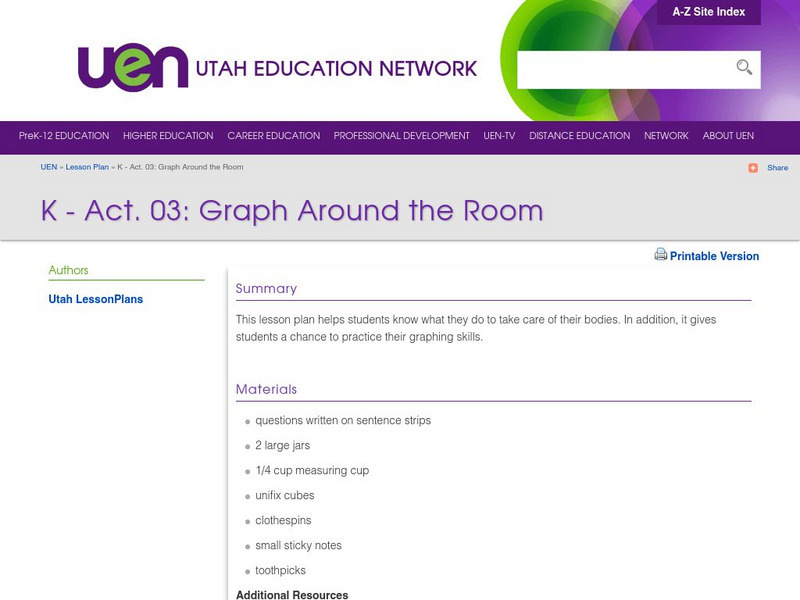
Uen: K Act. 03: Graph Around the Room
In this lesson, young scholars will learn about how to keep good hygiene. While learning, students will practice their graphing skills.
Government of Alberta
Learn Alberta: Math Interactives: Exploring Data Display and Graphs
This multimedia Learn Alberta math resource focuses on graphing data. In the video portion, students will see how math is involved in the display of merchandise in stores. The accompanying interactive component provides an exploration...
TeachEngineering
Teach Engineering: Complex Networks and Graphs
Students learn about complex networks and how to represent them using graphs. They also learn that graph theory is a useful mathematical tool for studying complex networks in diverse applications of science and engineering, such as...
Texas Education Agency
Texas Gateway: Evaluating Data in Tables, Graphs and Charts
[Accessible by TX Educators. Free Registration/Login Required] In this lesson students look at examples of graphics, tables, charts, and graphs, and learn how to interpret their data. They will be able to use this skill to enhance their...
US Department of Education
National Center for Education Statistics: Create a Graph Tutorial
This tutorial walks students through how to create different types of graphs using the Create a Graph tool available on the website. Covers bar graphs, line graphs, pie charts, area graphs, scatter plots, and dependent and independent...
CK-12 Foundation
Ck 12: Physics: Motion Study Guide
This study guide on motion covers some key vocabulary and terms to describe motion: displacement vs. distance, acceleration, speed vs. velocity, and instantaneous vs. average. It includes graphs showing distance vs. time, velocity vs....
Texas Education Agency
Texas Gateway: Graphing Data to Demonstrate Relationships
Given problem situations, the student will graph data with a constant rate of change to demonstrate relationships in familiar concepts, such as scaling.
University of Canterbury
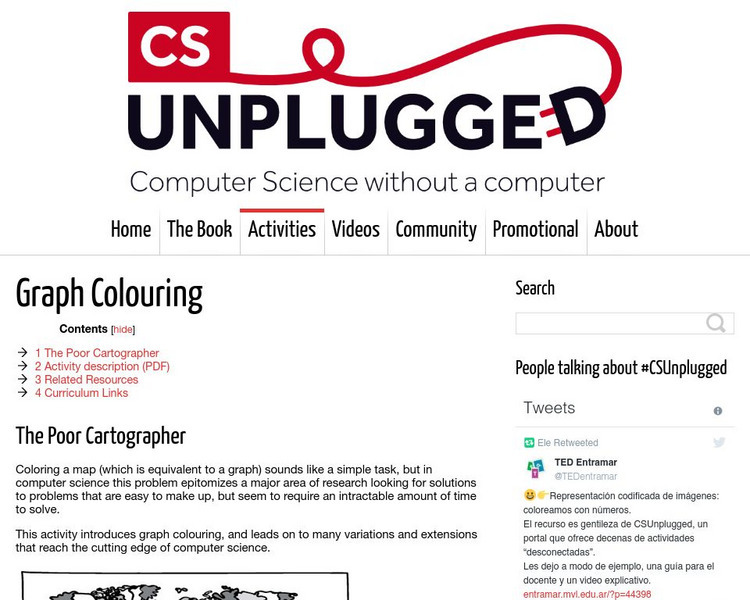
University of Canterbury: Cs Unplugged: Graph Colouring
Introduce graph coloring, and lead students on to many variations and extensions that reach the cutting edge of computer science.
CK-12 Foundation
Ck 12: Algebra: Graphs of Rational Functions Study Guide
This comprehensive study guide highlights the main terms and formulas needed to understand graphs of rational functions. Examples are included.
Better Lesson
Better Lesson: Graphing Our Snack Mix: Review of Graphing
Second graders review how to make bar graphs, line plots, and pictographs by tallying the contents of snack mix and building graphs to show their data.
PBS
Pbs: Location Graphs
Use your skills of deduction to fill in the missing information and demonstrate your expertise at interpreting graphs. This interactive exercise focuses on how line graphs can be used to represent data and provides an opportunity to...
PBS
Pbs Learning Media: Graphs, Charts, and Tables: Targeted Math Instruction
At the end of this lesson about graphs, charts, and tables, students will be able to interpret and compare data from graphs (including circle, bar, and line graphs), charts, and tables.
CK-12 Foundation
Ck 12: Statistics: Line Graphs Grade 7
[Free Registration/Login may be required to access all resource tools.] Make a line graph to display data over time.
CK-12 Foundation
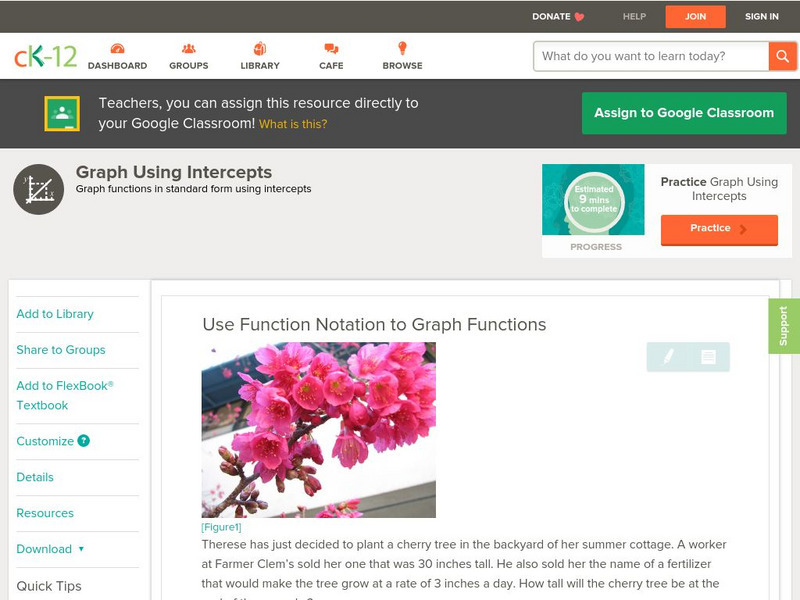
Ck 12: Algebra: Graphs of Linear Functions
[Free Registration/Login may be required to access all resource tools.] Students learn to use function notation to graph functions. Students examine guided notes, review guided practice, study vocabulary, watch instructional videos and...
CK-12 Foundation
Ck 12: Algebra: Graphs of Quadratic Functions in Intercept Form
[Free Registration/Login may be required to access all resource tools.] Find the x-intercepts and vertex of a quadratic function by writing it in intercept form and solve real-world problems. Students examine guided notes, review guided...
CK-12 Foundation
Ck 12: Statistics: Line Graphs to Display Data Over Time
[Free Registration/Login may be required to access all resource tools.] Create line graphs to display how data changes over time.
Can Teach
Can Teach Lesson Plan: Graphing Constellations
In this lesson plan, students practice their graphing skills by following directions to recreate constellations.
CK-12 Foundation
Ck 12: Algebra: Absolute Value Equations and Inequalities Study Guide
This comprehensive study guide highlights the main terms and formulas needed to understand absolute value equations and inequalities. Examples are included.
Scholastic
Scholastic: Bars, Lines, and Pies
Students will learn and reinforce skills for creating, applying and analyzing pie charts, bar graphs and line graphs.
Other popular searches
- Graphing Skills Lesson Plans
- Basic Graphing Skills
- Organizing and Graphing Data
- Introducing Graphing Skills
- Graphing Skills Using M&ms
- Graphing Skills in Science
- Graphing Skills for Prek
- Graphing Skills With Fruits
- Graphing Skills in Chemistry
- Graphing Skills for Perk
- Graphing Skills Worksheet
- Reading Graphing Skills


