Texas Instruments
Vandalism 101
Learners explore logic and use Geometer’s Sketchpad and patterns of logic to solve a puzzle.
Curated OER
Exploring Quadratic Data with Transformation Graphing
Using a data collection device to collect data regarding a bouncing ball, young scholars use various features on graphing calculators to experiment with the parameters of the vertex form of the parabola and their effect on the shape of...
Curated OER
Exploring Quadratic Data : Transformation Graphing
High schoolers analyze the vertex form of a parabola and find an approximate fit of a model. They explain the quadratic parabola function and its properties by developing quadratic models. They use translation and dilation to change the...
Curated OER
Dog Pen Problem
Teach your class about various approaches to solving the problem of maximizing the area of a rectangle space with a fixed perimeter in the context of a farmer's dog pen. Then, they complete a worksheet independently to summarize the...
Curated OER
Vernier - A Speedy Slide with EasyData™ App and CBR 2™
Mathematicians use a CBR 2™ motion detector to determine their speed or velocity going down a playground slide. They also experiment with different ways to increase their speed going down the slide. Finally, students complete the Student...
Curated OER
Bouncing Ball
High schoolers collect height versus time data of a bouncing ball using the CBR 2™ data collection device. Using a quadratic equation they graph scatter plots, graph and interpret a quadratic function, apply the vertex form of a...
Curated OER
Math TODAY - Breast Cancer Risks
Learners explore data that be modeled by a logistic function. They have the opportunity to study real-life data and create a mathematical function to model the data and make a prediction.
Curated OER
Strike a Pose: Modeling in the Real World (There's Nothing to It!)
Adjust this lesson to fit either beginning or more advanced learners. Build a scatter plot, determine appropriate model (linear, quadratic, exponential), and then extend to evaluate the model with residuals. This problem uses real-world...
Curated OER
Investigating Correlation
High schoolers investigate different types of correlation in this statistics lesson. They identify positive, negative and no correlation as it relates to their data. They then find the line of best fit for the plotted data.
Curated OER
FCAT Real World Solving Linear Equations/Systems
Pupils relate real life situation to the equations, graphs and inequalities. They model real life scenarios using matrices and draw conclusions from their data. This lesson plan is aligned with FCAT.
Curated OER
Let's Gather Around the Circle
Scholars explore the relationship between circumference and diameter. Groups of learners measure the diameter and circumference of round objects and record their data on a given worksheet. They then input the data into their graphing...
Curated OER
To the Moon
Pupils explore circumference manipulating Moon Pie wrapper. In this geometry lesson, they manipulate snack wrappers to find circumference, diameter, radius and distance.
Curated OER
Walk the Line
Learners create constant speed versus motion graphs. They will perform linear regressions on their data to describe the graphs mathematically.
Curated OER
Flipping Coins: Density as a Characteristic Property
Young scholars explore linear functions in a crime solving context. They collect and analyze data using linear equations, then interpret the slope and intercepts from a linear model.
Curated OER
Curve Fitting
Pupils investigate linear, quadratic, and exponential regressions. They plot sets of data points, determine the regression equation that best fits the data and lastly investigate the coefficient of determination.
Curated OER
TI-Nspire Activity: What Does Your Representation Tell You?
By learning to select the best representation for three meal plans, students compare three meal plans to determine the best choice. Data for the meal plans is sorted on a table, as an algebraic equation, and graphed on a coordinate grid....
Texas Instruments
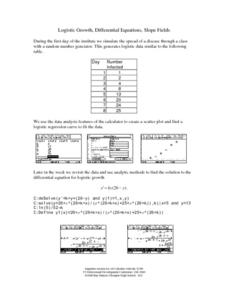
Logistic Growth, Differential Equations, Slope Fields
Investigate differential equations with your class. They use the TI-89 to explore differential equations analytically, graphically, and numerically as the examine the relationships between each of the three approaches.
Curated OER
TI-89 Activities for PreCalculus and AP Calculus
Using the TI-89 calculator, young scholars explore the statistical, graphical and symbolic capabilities of the TI-89. Students investigate topics such as solving systems of equations, finding inverse functions, summations, parametrics...
Curated OER
Logistic Growth
Through the exploration of population growth of a bacteria population, students learn about and observe bacteria population over a 20 hour period. Students graph the population growth using a scatter plot and discuss its logistic...
Curated OER
Guess the Ages
Learners explore scatter plots in this algebra lesson. They create a scatter plot from their guesses regarding a famous person’s birth date and the actual birth date then they examine and interpret the results of their graph.
Texas Instruments
Let's Play Ball with Families of Graphs
Learners explore quadratic equations in this Algebra II instructional activity. They investigate families of quadratic functions by graphing the parent function and family members on the same graph. Additionally, they write the equation...
Curated OER
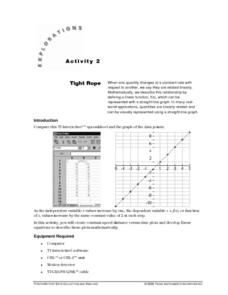
Tight Rope
Learn how to explore the concept of linear functions. In this linear functions lesson, students collect linear data from a motion detector. Students walk to create a linear function. Students plot the points on a graph and determine a...
Texas Instruments
Making Predictions Using Systems of Equations
Students explore the concept of systems of equations. In this system of equations lesson, students enter data into lists on their calculators about 100 meter dash times. Students plot the points using a scatter plot and perform a linear...
Curated OER
Exponential Decay
Young scholars study exponential decay and its application to radiocarbon dating. In this exponential decay lesson, students use candy to model the time it takes for something to decay. Young scholars also graph the data they collect and...


