Crash Course
Randomness: Crash Course Statistics #17
You'll probably end up thinking about randomness the next time you eat fries. The 17th video in the Crash Course Statistics series uses an analysis of McDonald's french fries to look at the mean and expected value of random...
Crash Course
Geometric Distributions and the Birthday Paradox: Crash Course Statistics #16
It's your birthday! But, maybe other people's, too. An illuminating video describes how to apply geometric probability distributions in real-world situations. It then reveals how probability helps explain the birthday paradox.
Teacher's Pet
Using Math to Analyze Data
No one wants to be average, so mathematicians use the term mean instead of average. The video explains how to calculate the mean, how to calculate the percent error, and why this information is important. Finally, the video considers the...
Khan Academy
Khan Academy: Statistics: Binomial Distribution 2
Video continuing an example of a binomial distribution for the amount of heads in five flips of a coin by drawing the graph and including discussion on how the distribution relates to a normal bell curve. Also includes explanation of why...
Khan Academy
Khan Academy: Statistics: Binomial Distribution 4
Video demonstration continuing an example of a binomial distribution for the amount of free throw shots made out of six shots. Excel is used to calculate probabilities and graph the distribution. Video is also listed in the probability...
Khan Academy
Khan Academy: Statistics: Binomial Distribution 1
Video reviewing binomial probability, including binomial coefficients, and leading up to binomial distributions. An example with the probabilities of the different number of heads in five flips of a coin. Video is also included in the...
Khan Academy
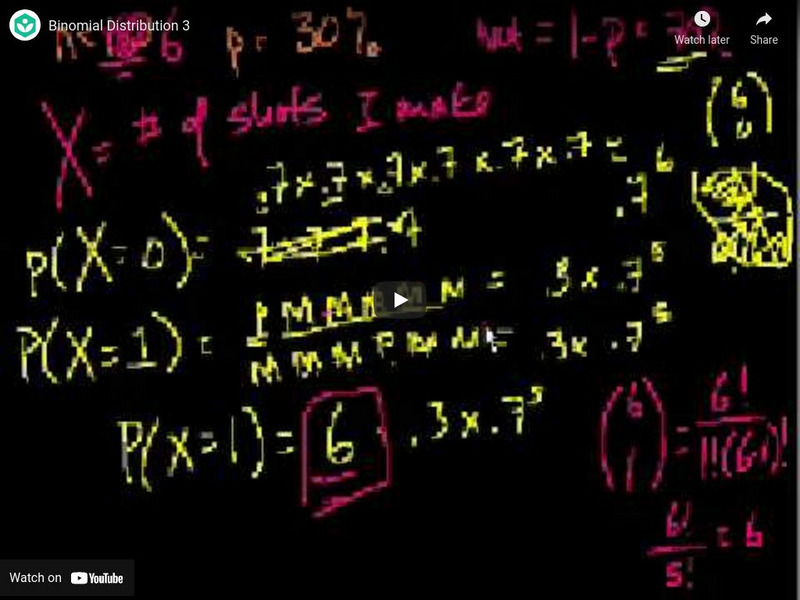
Khan Academy: Statistics: Binomial Distribution 3
Video demonstration of finding the binomial distribution for an example about shooting six free throw shots by calculating the probabilities of each number of shots that were made. Video is also listed in the Probability section of Khan...
Khan Academy
Khan Academy: Statistics: Sampling Distribution Example Problem
Video example of using a sample distribution to solve a problem determining the probability that a sample mean is below a certain number. Includes example of finding a z-score and looking it up in a table to determine the probability....
Khan Academy
Khan Academy: Inferential Statistics: Confidence Interval 1
Video showing how to determine the probability that the population mean is between two given values when given the mean and standard deviation of a sample. Uses sampling distribution and calculates a z-score in order to determine the...
Khan Academy
Khan Academy: Statistics: Mean and Variance of Bernoulli Distribution Example
Video giving example of a Bernoulli distribution and showing how to calculate its mean, variance, and standard deviation leading up to deriving the formulas for mean, variance and standard deviation of a Bernoulli distribution which will...
Khan Academy
Khan Academy: Statistics: Bernoulli Distribution Mean and Variance Formulas
Video example of what a Bernoulli distribution is. Demonstrates how the general formulas for the mean and variance of the distribution are derived. [6:59]
Khan Academy
Khan Academy: Statistics: Difference of Sample Means Distribution
Video shows visually and reviews notation for sampling distributions of random variables. It then visually shows the distribution of the mean of the difference of two random variables and gives the formulas for the mean and variance of...
Khan Academy
Khan Academy: Statistics: Expected Value E(x)
Video explains the relationship between expected value and population mean and provides an example of calculating expected value using frequencies. [14:53]
University of New South Wales (Australia)
University of New South Wales: Prob Stats6: Binomial and Geometric Distributions
In this lecture for an introductory probability and statistics course, the instructor goes over binomial and geometric distributions, as well as sign tests. [52:21]
Khan Academy
Khan Academy: Statistics: Margin of Error 1
Video example of calculating the mean, variance and standard deviation of a sample of a Bernoulli distribution. Video is leading up to creating a confidence interval which will be shown in the next video. [15:02]
Khan Academy
Khan Academy: Statistics: Margin of Error 2
Video continues from previous video to show how to create a confidence interval for the population mean from a sample taken from a Bernoulli distribution. [10:05]
Khan Academy
Khan Academy: Statistics: Normal Distribution Excel Exercise
Video discusses the importance of the normal distribution. The formula for the normal distribution is given and explained. A url is given where an excel spreadsheet can be downloaded which is shown and used to compare the binomial...
Khan Academy
Khan Academy: Bernoulli Distribution Mean and Variance Formulas
Video example of what a Bernoulli distribution is. Demonstrates how the general formulas for the mean and variance of the distribution are derived.
Khan Academy
Khan Academy: Probability Density Functions
A video abour probability density functions for continuous random variables.
Sophia Learning
Sophia: Expected Value: Lesson 1
This lesson will explain expected value. It is 1 of 3 in the series titled "Expected Value." [6:12]
Sophia Learning
Sophia: Expected Value: Lesson 3
This lesson will explain expected value. It is 3 of 3 in the series titled "Expected Value." [8:00]
Imagine Learning Classroom
Learn Zillion: Video: 'Model a Data Set With a Normal Probability Distribution'
In this lesson, you will learn how to model a data set with a normal probability distribution by using the mean and standard deviation of the data set. [4:59]
Khan Academy
Khan Academy: Bernoulli Distributions and Margin of Error: Margin of Error 1
Video example of calculating the mean, variance and standard deviation of a sample of a Bernoulli distribution. Finding the 95% confidence interval for the proportion of a population voting for a candidate.


