Mathispower4u
Writing Equations from Tables - Squaring
By watching an informative video, young mathematicians learn how to write an equation from a table. In this case, the underlying equation is no longer linear, but rather it is quadratic.
Mathispower4u
Writing Equations from Tables - Linear I
Don't table the video. Using a pattern found in a table of values, pupils write equations to represent the relationship between the inputs and outputs before creating graphs to verify their results. They view the process and hone their...
PBS
Beating Usain Bolt
Beating Usain requires a head start. With a race against Usain Bolt as a background, the resource introduces a system of linear equations. A quick activity uses tables to determine whether a head start is enough for the presenter to win...
Mathispower4u
Graphing Equations by Plotting Points - Part 1
It's not magic, it's math! Observe as a collection of points becomes a line. Scholars watch as a video instructor creates a table of values to graph linear equations. Examples include equations in both slope-intercept and standard forms.
Corbett Maths
Line Graphs
Here's a lesson sure to keep classes in line! A straight-to-the-point video explains the steps of creating a line graph from a table of data. Following the video, learners have plenty of opportunities to practice with the included...
FuseSchool
Calculator Trick—Table of Values
Work smarter, not harder! Learn a function of the calculator that assists with creating a table of values. The calculator does the work of substituting values and finding the input-output pairs.
FuseSchool
Drawing Quadratic Graphs
How does a quadratic function create its shape? Scholars examine the graphs of quadratic functions in an informative video lesson. By creating a table of values, learners see the patterns in the numbers that appear in the graph.
National Education Association
Writing Linear Equations
No matter how it is written, it still is a line. A video shows class members how to take points and write the equation of the line that goes through those points. It then outlines how to develop the equation whether...
Brightstorm
Exploring Quadratic Graphs - Concept
Show your class how to use properties to make graphing easier with a resource that explores the graphs of quadratics. Using tables to determine the points to graph, pupils discover the symmetry of parabolas in...
Brightstorm
Limits: A Numerical Approach
The sky's the limit — or is it? Viewers learn how to determine limits using a numerical approach through an example in the first installment of a 9-part video series on limits and continuity. The video also introduces formal...
Khan Academy
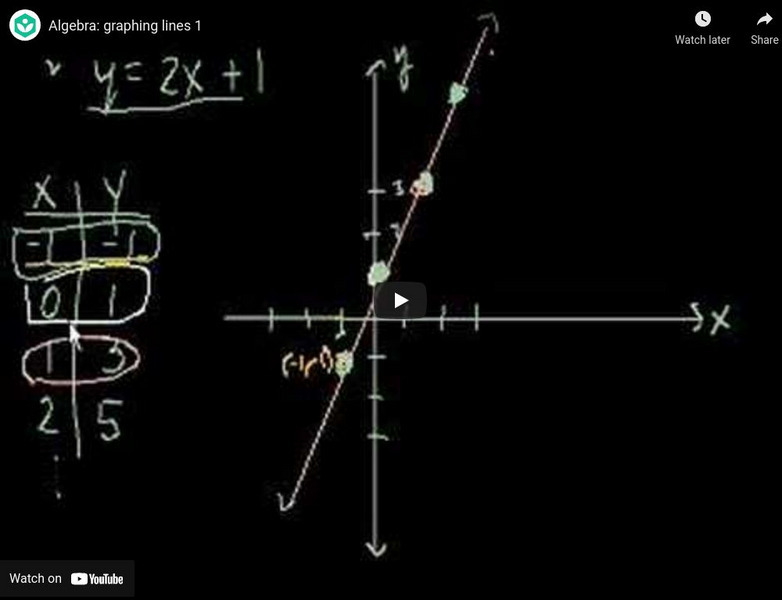
Khan Academy: Algebra: Algebra: Graphing Lines 1
This video demonstrates how to make a table of x and y values in order to graph the equation of a line. [9:50]
Khan Academy
Khan Academy: Graphing a Quadratic Function
Demonstrates how to graph a quadratic function by creating a table of values. This video also appears in the Algebra: Functions strand. [6:03]
Virtual Nerd
Virtual Nerd: How Do You Graph a Linear Equation by Making a Table?
To graph a function, you first need a table of values to fit your equation. This video will demonstrate how to make a table and then plot those values to make a graph. [3:23]
Virtual Nerd
Virtual Nerd: How Do You Make a Table of Values for a Linear Equation?
To graph a linear equation, you first need to make a table of values to plot. This tutorial will teach you how to set up this table of values using an example. [5:41]
Khan Academy
Khan Academy: Algebra: Graphs of Linear Equations
This video demonstrates how to graph a linear equation by creating a table of x, y values to use as coordinates for the graph of the line. The second example demonstrates how to take a word problem and create a table of values to graph...
Khan Academy
Khan Academy: Quadratic Equations: Graphing a Parabola With a Table of Values
Demonstrates how to graph a quadratic function by creating a table of values. [7:03]
Khan Academy
Khan Academy: Comparing Linear Functions: Table vs. Graph 2
Video lecture examines how to compare linear functions given a table of values and four linear graphs. How do you determine which graph increases faster than the function represented in the table? [3:39]
Virtual Nerd
Virtual Nerd: How Do You Graph a Linear Equation by Making a Table?
See how to graph a function by making a table of values that fir your equation. [3:24]
Virtual Nerd
Virtual Nerd: How Do You Graph a Quadratic Function?
Watch this tutorial to see how you can graph a quadratic equation. [5:46]
Khan Academy
Khan Academy: Algebra: Two Variable Linear Equations (1)
This video shows how to graph a linear equation by creating a table of (x,y) values that satisfy the equation and then plotting these values on a coordinate plane. Practice problems available. [4:29]
Study Pug
Study Pug: Absolute Value Functions
Absolute value is basically the distance between "number" and "zero" on a number line. You will learn more about this concept in this video. You will also learn how to express absolute value functions as piecewise functions. [10:47]


