SEN Teacher
Dice Printer
Let the dice decide your fate with this custom site that creates a die printable based on your needs. Pick from different sizes and custom label each face to use for fun activities.
Curated OER
Gold Rush California and its Diverse Population
Students compare contemporary cultural differences with historical differences based on population percentage. In this cross-curriculum Gold Rush/math lesson plan, students analyze aspects of California's Gold Rush population and...
Curated OER
Energy Audit
Students collect data about energy usage and use mathematical calculations to analyze their data. In this energy conservation and statistics math lesson, students survey their homes to complete an energy usage worksheet. Students...
American Institutes for Research
Data and Probability: Marshmallow Madness
Upper grade and middle schoolers make predictions, collect data, and interpret the data as it relates to the concept of probability. They work with a partner tossing marshmallows and recording if they land on their side or on their...
Curated OER
Data Analysis Using Technology
Analyze data using technology. Middle schoolers design data investigations, describe data, and draw their own conclusions. Then they select the best type of graph, graph and interpret the data, and look for patterns in trends. They also...
Curated OER
Bar Graphs With Intervals
Give your math class a comprehensive understanding of bar graphs with this series of lessons. The resource is divided into three parts, and all of the accompanying worksheets are included. The class will study different bar graphs,...
Curated OER
Building Brilliant Bar Graphs
Everything you need for a mini-unit on bar graphs is included in this lesson plan! It outlines three lessons and includes worksheets. Learners taste pretzels, shoot baskets (switching off hands), and grab candy, graphing results...
Curated OER
Probability Games and Activities, Unit 10
Looking for tangible ways to practice probability with your class? Through 4 activities, students practice with experimental probability, using math to make educated guesses, then testing it through physically completing the experiment....
Curated OER
Go Fish
Help learners discover methods to estimate animal population. They will participate in a simulation of catching and tagging fish in order to estimate the fish population. They scoop and count goldfish crackers, record data, and use...
American Statistical Association
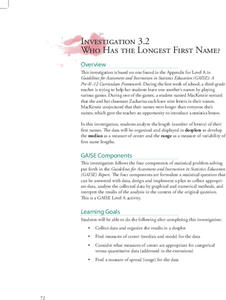
Who Has the Longest First Name?
Name that statistic! Classmates each write their name and the number of letters in it on a sticky note to place on the board. As a class, they determine the median, mode, and range of the name lengths, and create a dot plot of the data....
American Statistical Association
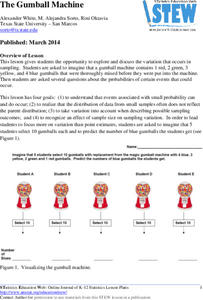
The Gumball Machine
Chew on an activity for probability. Given information on the number of gumballs in a gumball machine, scholars consider how likely it is to randomly draw a blue gumball and how many of each color they would draw in 10 trials if the...
American Statistical Association
The Mean and Variability from the Mean
Discover the mean from fair share to the balance point. The lesson takes small groups of pupils through two different interpretations of the mean, the fair share understanding of the mean, and the balance point. Scholars use the...
NASA
Soda-Straw Rockets
Launch a great lesson exploring engineering design. Using a template, young scholars create rockets that can be launched from a straw. After analyzing the function of the rocket, pupils try to modify the rocket to enhance its function.
NASA
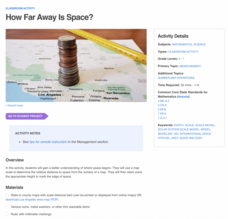
How Far Away Is Space?
Space is about 60 miles from the surface of Earth. Pupils make calculations to model that distance by stacking coins the appropriate height using scale. They then explore the distance to objects in space such as satellites and the space...
Bowland
Tuck Shop
Correct a misleading conclusion. Individuals review a set of data and a conclusion to determine what is wrong with the conclusion. Pupils then represent the data with an appropriate display. Finally, learners develop a correct conclusion...
US Department of Commerce
Immigration Nation
People come and people go. Given tabular census data on the annual number of immigrants from four different regions of the world between 2000 and 2010, pupils create double bar graphs and line graphs from the data. They analyze their...
US Department of Commerce
Let's Count!
Counting objects is easy as one, two, three. Young mathematicians count objects in the classroom and create data tables to record their results. They then write comparison statements and answer questions about the data.
US Department of Commerce
My Dream Home
Dream big or go home. After analyzing a bar graph on the number of bedrooms in US homes derived from census data, scholars design their own dream homes. They cut out two-dimensional shapes from construction paper to create models of...
US Department of Commerce
Comparing My State
How does your state compare? Using census data, scholars determine the total population and the number of 11-year-old boys and girls in two different states. They round and compare values, and then make up a question about the two states...
US Department of Commerce
The Place of My State
State the population of the state. Pupils research census data on the total population, the number of children their age, and the number of children of the same age and gender in their states. They write these numbers in standard,...
US Department of Commerce
Changes in My State
So much can change in seven years. Young statisticians choose three types of businesses, such as toy stores and amusement parks, and use census data to determine how the number of those businesses in their state changed between 2010 to...
US Department of Commerce
Using Fractions to Compare Amusements Parks By States
Amuse learners with a lesson on amusement parks and fractions. Using provided census data on the number of amusement parks in each state, third graders represent the fraction of states that fall within a certain range. They create a...
US Department of Commerce
Learning About College Degrees and Lifetime Earnings
It's never too early to start thinking about college majors. Using census data, scholars research the lifetime earnings for two selected careers. They then write and solve word problems to compare the amounts. To add a visual component,...
US Department of Commerce
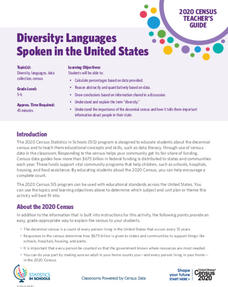
Diversity: Languages Spoken in the United States
High schoolers begin a discussion on diversity and determine the percent of the population that speak another language at home in the US. Classmates make a prediction of the percentage of people that speak another language at home in...


