Wise Owl Factory
Happy Father's Day
Celebrate Father's Day this year with a fun math and coloring activity! After counting all of the dad-related pictures and graphing their frequency, learners color a Father's Day card to give to their dads.
Wise Owl Factory
Mother's Day Graphing
A Mother's Day-themed math activity reinforces counting and graphing. Scholars count pictures and roll a festive die then graph their findings using a bar graph.
Curriculum Corner
Meet the Teacher Night
Use a packet of colorful chalkboard-themed Meet the Teacher Night sign-in and information sheets as part of your back-to-school activities. The packet is complete with welcome signs, classroom labels, methods of transportation labels,...
Royal Baloo
Star Wars K-2nd Math Pack
Included in a Star Wars themed packet, young padawans enhance mathematical skills such as graphing, computing using basic operations, counting numbers and money, telling time, and measuring. Scholars play a game of sudoku, read number...
Los Angeles County Office of Education
Assessment for the California Mathematics Standards Grade 1
Here is an assessment designed to test mathematicians' knowledge of writing numbers, comparing numbers, skip counting, solving addition and subtraction problems; along with measuring objects, telling time, identifying shapes, reading...
Worksheet Place
How I Get to School
Find out how many of your learners take the bus, how many walk, and how many bike with a quick survey. Class members gather data about how each individual gets to school and mark the results on this page in order to create a bar graph.
Curated OER
Reading Tables
Who is two years younger than Meg? Who is older than Paul, but not Kinta? Scholars practice reading tables as they answer comprehension questions based on three sets of data. First, they examine a table depicting ages, then favorite...
Curated OER
Graphs
For beginners to picture graphs this is the perfect resource. They analyze two bar graphs that break down data visually so scholars can actually count the number in each column. For the first, they fill in how many of each type of pet is...
Curated OER
Easter Graphing Fun
Graphing can be festive! This Easter worksheet has scholars using coordinates to record the location of ten holiday images. The first is done for them, and the grid is large and appealing to younger learners. Consider visualizing this...
Curated OER
A Day at the Beach
Let's go to the beach! Danielle, Marty, and Phil collected shells at the beach. Can you determine how many shells each child has? Create a picture graph to make the data easier to understand.
Curated OER
Count the Images!
Based on a selection of images, learners create a bar graph depicting how many of each image is shown. There are two graphs, each with three images to chart. After they are finished, scholars can analyze the data and draw conclusions. To...
Curated OER
Make a Table
First and second graders participate in an experiment then create a table of tally marks to identify the totals. They problem solve, tally twenty experiences, and generate an answer to one question.
Curated OER
Reinforcement: Point/Sticker Cards
I love these! Print, cut, and laminate any of these sticker cards to help you manage classroom behavior in a positive way. Tape the blank chart on your learner's desk,or reward him by giving a point or sticker in each of the squares....
Curated OER
Using Grams and Kilograms
Practice the metric system with this basic worksheet. Guided by a fun illustration of a mouse, learners problem solve using a balance scale. Two graphic organizers allow them to record their findings in grams and kilograms.
Curated OER
Measuring Time in Minutes
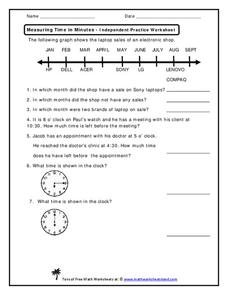
Time is measured in both months and minutes; scholars first examine a line graph to see in which months an electronic shop had sales on specific laptop brands. They answer three questions about the data. Then, they determine how much...
Curated OER
Generate Measurement Data Word Problems
Using a set of simple data, learners create a line plot to organize the information. This data includes only single-digit numbers and the highest number is six. Because the answer is explained and illustrated at the bottom, project this...
Curated OER
Teaching Ideas and Resources
In this teacher website, teachers have access to a variety of tools and resources. Teachers can utilize plans, lessons, and worksheets in all subject areas.
Curated OER
Make Your Own
Your first and second graders will categorize hearts, triangles, and stars, putting them in a picture graph. After the shapes are organized, they compare the number of each using the sentence frames provided.
Curated OER
How Many?
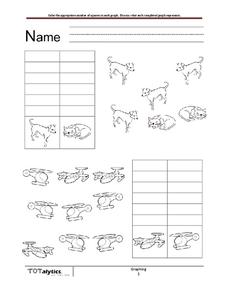
How many cats are there? Dogs? As learners examine a set of images, they fill in a chart to indicate how many of each image there are. In the first series, there are four dogs and two cats. In the second, there are three planes and six...
Curated OER
Behavior tracking sheet
Here is a template for tracking and recording an expected behavior. For use with an Autistic pupil working on verbal communication skills, this sheet provides a way to track the number of times and prompts needed for the him to ask for...
Curated OER
Froot Loop Graph
In this froot loops graph worksheet, students graph the colors of the fruit loops they have. Students graph 6 colors of fruit loops on the graph.
Curated OER
Gumball Math
In this subtraction worksheet, students solve one digit subtraction problems in gumballs and then color them according to the answer coloring key. Students then graph the colors.
Curated OER
Bee Count and Graph Book
In this counting and graphing worksheet, students count the number of bees on each page and graph the total number counted by filling in the squares at the bottom of each page. Students answer ten problems.
Curated OER
Picturing Hats
In this pictographs worksheet, students examine a pictograph then solve 11 problems related to the data in the pictograph. Students cross out problems that do not relate to the pictograph.


