Curated OER
Our Daily Five
Students explore the food pyramid through a class discussion, hands-on experience with food items, and a floor game that helps them to identify the food group involved. Lesson extensions include the use of play money, art, and dance.
Khan Academy
Khan Academy: Make Bar Graphs 1
Practice creating bar graphs (bar charts) from data sets. Students receive immediate feedback and have the opportunity to try questions repeatedly, watch a video or receive hints.
Khan Academy
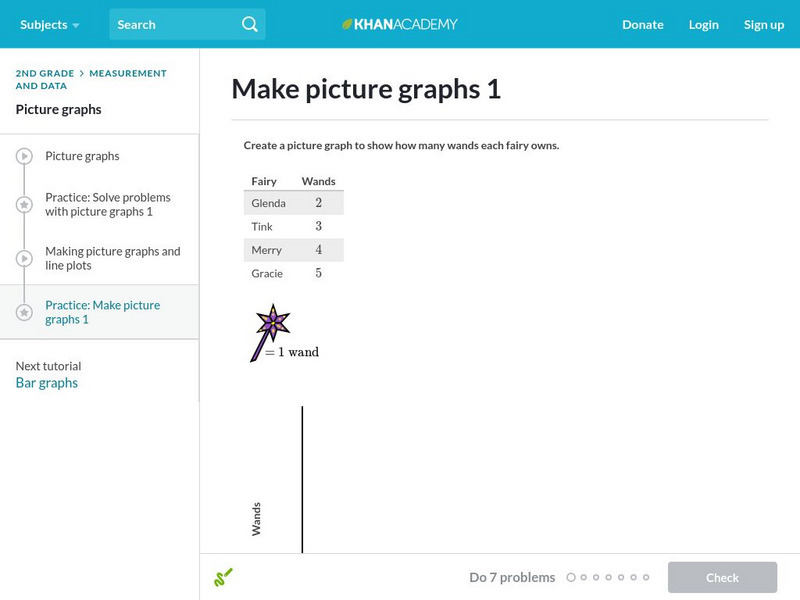
Khan Academy: Make Picture Graphs 1
Practice creating picture graphs (pictographs) from data sets. Students receive immediate feedback and have the opportunity to try questions repeatedly, watch a video or receive hints.
Education Place
Houghton Mifflin: Eduplace: Make a Living Bar Graph
Student use simple data to line up in a living bar graph activity when they respond to simple questions in this lesson plan. They physically and visually represent the data. CCSS.Math.Content.3.MD.B.3 Draw a scaled picture graph and a...
E-learning for Kids
E Learning for Kids: Math: Music, Dance Performance: Chance & Data
Nadir and his family play in a band. Can you help him get all the instruments together? In these activities, students will write data using symbols, use one object to represent one item, create a column graph, and determine whether...
ClassFlow
Class Flow: Picture Graphs
[Free Registration/Login Required] This flipchart has the definition of a picture graph. It is designed for students to use various picture graphs to solve math problems. There are even picture graphs made with no questions - leaving it...
ClassFlow
Class Flow: Ice Cream Bar Graph
[Free Registration/Login Required] This flipchart reviews bar graphs, how to create them and read them. Excellent activity to get your students involved in a tasty math activity!
Khan Academy
Khan Academy: Make Line Plots
Practice creating line plots (dot plots) from data sets. Students receive immediate feedback and have the opportunity to try questions repeatedly, watch a tutorial video, or receive hints.
Alabama Learning Exchange
Alex: You Scream, I Scream, We All Scream for Ice Cream !
Fun and yummy lesson to do on a sunny spring afternoon. Have the learners take a poll of their favorite choice of ice cream and create a bar graph showing the information. This lesson plan was created as a result of the Girls Engaged in...
Alabama Learning Exchange
Alex: Wheels All Around
Students will use skip counting to see how many wheels visit the school during specified times in one day. This lesson plan was created as a result of the Girls Engaged in Math and Science University, GEMS-U Project.
Alabama Learning Exchange
Alex: Jelly Beans Add Up
The instructional activity will explore counting, sorting, and graphing skills. The instructional activity provides students an exciting and fun way of exploring and internalizing graphing, sorting, and counting skills. Realistically,...
Alabama Learning Exchange
Alex: Away We Go!
Students will survey various classes about the type of transportation that delivers them to school. Students will then combine data and with the help of a teacher create a virtual graph. This lesson plan was created as a result of the...
Alabama Learning Exchange
Alex: What's That Coin?
This Five E's AMSTI lesson prompts students to pay close attention to the details on each of the four U.S. coins as they learn the coin names. Students watch a video clip about the differences in the coins, sort real coins by attributes,...
EL Education
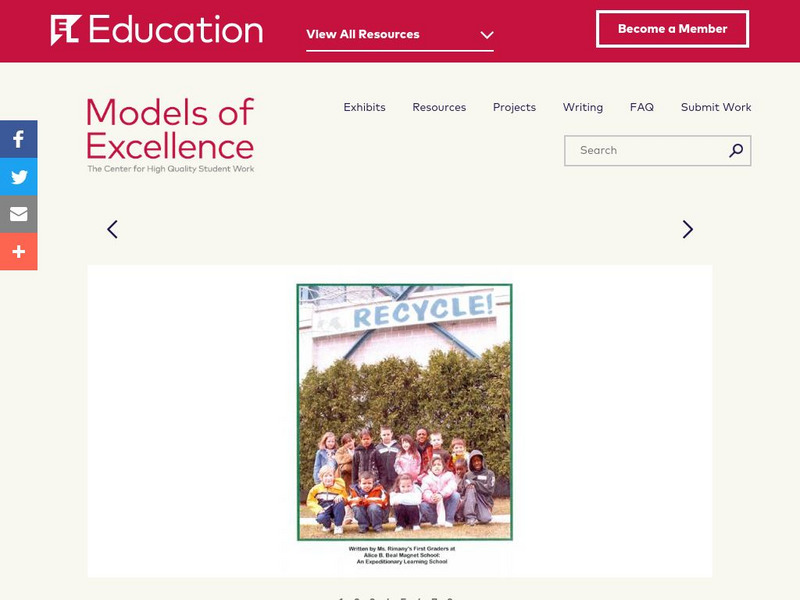
El Education: Recycling
Students find out how many bags of garbage their school produces and work through math processes to create graphs and make projections. Then they share this information with the school and make suggestions about how to decrease the...


