Math Drills
Valentine's Day Ordering and Comparing (A)
Youngsters use a data table to answer questions, in a Valentine's Day-themed worksheet.
Curated OER
Sorting Sweethearts
In this holiday worksheet, students estimate how many heart candies are in a cup. Then, students sort their hearts and add up how many are in each color and how many there are total. Students also create a bar graph that displays how...
Curated OER
Tracking Fall's Falling Temperatures
Young meteorologists track weather from day to day and record results on graphs, maps, or other places. They see firsthand how weather temperatures trend cooler as fall progresses and practice grade-appropriate skills in geography (map...
Curated OER
Favorite Fruit
In this graphing learning exercise, 1st graders create a bar graph showing the favorite fruits of their classmates. They analyze their bar graph by answering five comprehension questions.
Curated OER
How Deep Do They Dive
Learners calculate and graph the diving depths of various types of whales. They cut out and glue whale pictures on a worksheet to represent the diving depths for five whales, and discuss how people use graphs to communicate.
Curated OER
Jelly Belly: What a Wonderful "Bean"!
Students explore how jelly beans are produced. They discuss the origins of the jelly bean and view a video about how jelly beans are prepared, tested, shaped, finished, and shipped and estimate the amount of jelly beans in a jar and sort...
Curated OER
Apple Graphing
Learners sample a variety of types of apples and then survey each other regarding their favorites. They chart how many students prefer each type of apple.
Curated OER
Girl Scout Cookies Graph
Students graph which girl scout cookies they like the best. They create a Venn Diagram about which one is their favorite. They place cookie shaped cutouts on the correct spot on the graph.
Curated OER
Graph It!
First graders use organized data to construct real object graphs, picture graphs, and bar-type graphs.
Curated OER
Get Your Pupils Moving While Learning
Use these teaching strategies to get the wiggles out and keep the learning in!
Laura Candler
Time Capsule
It's amazing how much kids change from the beginning of the year to the end. Create a written account of their growth with a fun worksheet that involves children recording information about themselves at two points...
Curated OER
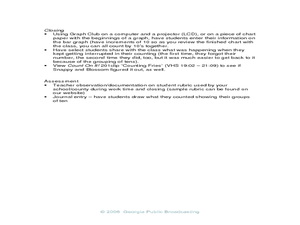
An Easier Way to Count: Using Groups of 10
Young scholars explore their counting skills. In this counting lesson, students group objects in sets of 10 to practice counting them. Young scholars also practice graphing the sets of objects they count. This lesson...
Curated OER
Berlioz the Bear
Young children read the story, Berlioz the Bear and complete various reading and writing activities. They learn about fiction and non-fiction, and complete graphing and writing activities for the story. Youngsters draw the bear and use...
Curated OER
Patterns Here, There and Everywhere
Pattern recognition is a skill often used in mathematics. Learners count and sort manipulatives, organize the data into a graph and answer questions about the information displayed. They collect the objects to be used and create patterns...
Curated OER
Butterfly Addition: Color by Numbers
Children learning to add numbers up to 11 develop the strategy of using the larger number as the first addend and counting on from there to find a sum. They define addition and review the meaning of the plus (+) symbol. To practice, they...
Curated OER
Grids
This fun presentation includes instructions for a grid game, where the child must follow directions to uncover the hidden treasure. They make Mr. Smiley move up, down, right, and left on the grid until he's reached the...
Curated OER
How Do You Feel Today?
Students create a graph, then listen to Dr. Seuss' book, My Many Colored Days. After the story, they do a similar graph and then compare the two graphs.
Curated OER
Graphing With Young Children: Math
Students create a template for a quality graph. They graph from scratch to match these criteria. They evaluate, in writing, the data represented in their newly created graph.
Curated OER
Bananas! Bubble Gum! Which One?
Students design and create a graph of data they have collected on their favorite candy bars. They explore how to organize data as well.
Curated OER
Technology Blackout Day
Students describe the impact of modern technology inventions on daily life. They create a graph of the class's favorite item of technology and draw a picture of their favorite piece of modern technology.
Curated OER
Tracking Olympic Gold!
Learners use print or online resources to track the results of the Olympic Games, record daily results on graphs, use graphs to collect information.
Curated OER
Travel Fun
In this bar graph worksheet, students survey classmates about their favorite way to travel. Students then fill in one square for each response creating a horizontal bar graph.
Curated OER
Native Lands: Indian in Georgia
Students bring in vegetables that the Native Americans ate. In this vegetable lesson, students create a graph that shows how many students brought in each vegetable. They measure their vegetable to find the length, circumference, and...
Curated OER
Field Trip To The Fire Station
Students read and discuss fire safety and discover celebration of Firefighters' Day in various countries. They identify firefighting equipment, draw trucks, ambulances, ladders and other equipment. Students predict the type of equipment...


