Curated OER
Graph Those Stickers!
Students graph fruit. In this graphing lesson students create a graph using fruit label stickers. Students place a sticker on the graph when the fruit has been consumed.
Curated OER
How's the Weather?
Students explore earth science by researching the Internet. In this weather pattern lesson, students utilize the website weather.com to analyze the weather in different geographic locations. Students view charts and graphs based on...
Curated OER
The Air Up There
Learners observe the weather over a period of two weeks. They gather local weather data and calculate the mean and average figures from the data. They prepare a graph with their observations.
Curated OER
THIS WEEK'S WEATHER
First graders create a picture graph representing their town's weather for one week.
Curated OER
Chucky Chickadee's Bird and Breakfast: Sing in Please
Students observe bird feeding and complete a tally and graphing activity for their observations. In this bird graphing lesson, students work in teams to observe bird feedings. Students complete a bird reporting sheet and collect data...
Curated OER
Tracking Fall's Falling Temperatures
Young meteorologists track weather from day to day and record results on graphs, maps, or other places. They see firsthand how weather temperatures trend cooler as fall progresses and practice grade-appropriate skills in geography (map...
Curated OER
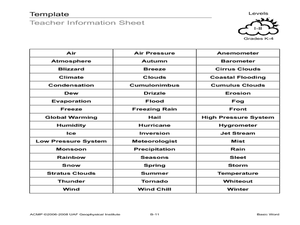
Basic Word
Students create a poster of a weather-related word. In this weather lesson plan, students randomly choose a weather word, define it, and draw a picture of it. They also use Word Art to create the title of their poster.
Curated OER
The Air Up There
In this data collection and analysis lesson, students observe and graph the weather conditions during one school week, then calculate the average weather temperature. Extensions are included.
Curated OER
Basic Excel
Students explore basic Excel spreadsheets. For this spreadsheet lesson plan, students enter Alaska weather information and perform calculations. Students title the columns on the spreadsheet and format the cells. ...
Curated OER
The Weather Forecast
Students observe a daily paper to see the temperature forecast looking at a paper thermometer with today's predicted temperature colored in. They predict today's temperature, and paste the second color on the same thermometer to show...
Curated OER
How to Beat the Rainy Day Blues
With a little ingenuity, lively exercise can occur despite the weather.
PBS
Dear Pen Pal
Explore cultures from around the world with an engaging pen pal resource. Through a series of classroom activities and written correspondence, children learn about the favoritec pastimes, schooling, geography, and weather that is...
Curated OER
Teach it to me - Seasonal Calendar
Students document the weather. In this seasons instructional activity, students study the weather, record the temperature outside and photograph what the weather conditions look like. All information gathered by the students will be made...
Curated OER
Fall is All Around Us
Students develop and create a production company and produce a fall event that demonstrates what they have learned in various subject areas. STudents create stories, complete a venn diagram comparing fall and summer, graph and measure...
Curated OER
Jumping to Conclusions
Students decide as a class what their data is going to be to graph. In this math lesson, students organize data so that it will be easier to display in a graph. Students are guided through the process by their teachers, and helped with...
Curated OER
Aspects of Weather
Learners recognize and observe weather phenomena. In this four part weather instructional activity, students are introduced to weather symbols through a story, then use a thermometer to measure water temperature. Next, learners observe...
Curated OER
The Hat
Honing reading and communication skills through the theme of farm animals is the focus of this lesson plan. Students read a book about Scandinavian farm animals and complete prediction journal activities. They complete a worksheet about...
Curated OER
The Air Up There
Students engage in a lesson that is concerned with the average daily weather patterns. They collect data over a five day period and then write a summary of the observations made from it. Students record the mean and graph it on a simple...
Curated OER
Taking In The Heat
Students discover that different textured materials can absorb more heat than others. Students work with thermometers, clocks, and graphs.
Curated OER
Clouds
Students explore basic cloud types and the weather associated with each one. In this earth science activity, students participate in numerous activities including going outside to observe the clouds they see, making a cloud in...
Curated OER
Introducing Temperature Measurement
Students explore temperature and use Celcius thermometers to measure and graph the temperature in the classroom daily. They estimate what they think the temperature might be and then find the actual temperature in the room.
Curated OER
Evaporation
First graders explore, analyze, document and study weather and the water cycle. They observe the weather and begin a weather journal. Each student interacts with the concepts of evaporation, condensation and precipitation, clouds,...
Curated OER
Farming: Natural Resources (Lesson 2)
Students identify the types of natural resources. They explain the difference between weather and climate. They practice using a rain gauge and reading a thermometer.
Curated OER
Rate It - Working With Positive and negative Numbers
Students practice rating things using numbers between -2 to 2. In this rating lesson plan, students determine what a rating scale is before rating things such as the weather, a book, or a day using the numbers -2 to 2. They examine the...
Other popular searches
- Graphing Weather Data
- Graphing Weather Activity
- Weather Graphing
- Weather Graphing Temperature
- Weather Graphing Probability

