Curated OER
Reading the Neighborhood
First graders complete activities with the story One Monday Morning in the Macmillan/McGraw Hill Textbook. In this data lesson, 1st graders read the story and gather data to create a picture graph. They read the graph and answer...
Curated OER
How Do You Like Your Eggs?
First graders conduct a poll about how people like their eggs. In this graphing lesson, 1st graders collect data about how they like their eggs. Students use a picture of themselves to place under the type of egg they like. Students then...
Curated OER
Sorting Sweethearts
Students categorize sweetheart candy by color or message. In this sorting and graphing lesson, students collect data by sorting the candy and then diagram their results in a graph.
Curated OER
Give Me A Break!
Students create and conduct a survey. In this broken bones lesson, students discuss if they've ever broken a bone and how a broken bone heals. Students generate questions for a survey on broken bones and healing time, conduct the survey...
Curated OER
Ice Cream Pictograph
Students create a graph. In this pictograph lesson, students cut out 20 small ice cream cones and decorate them. Students create a pictograph with their ice cream cones.
Curated OER
Measuring Inches
First graders measure the length of pipe cleaners to form worms using rulers to focus on inches. They record their results and graph the measurement of each pipe cleaner. They measure their pipe cleaner "worms" in various colors and...
Curated OER
M&M Graphing and Probability
Students create a variety of graphs. They count, sort, and classify M&M's by color and record data on a chart. They use data from the chart to create pictographs, bar graphs and circle graphs. They analyze data and determine...
Curated OER
Graphing with the Five Senses
Students collect data and record it on a bar graph. In this data graphing lesson, each small group of students is assigned to collect data on one of the five senses. They then practice a song that helps them remember the purpose of each...
Curated OER
Picture Graphs
In this mathematics worksheet, students look at pictures and identify how many of each object is illustrated. Then they graph their results on the graph given. Students also draw tally marks to count how many faces are in the pictures.
Curated OER
Shooting Stars Pictograph
In this pictograph worksheet, students use a given graph to answer a set of 5 questions. A website reference for additional resources is given.
Curated OER
Mr. Funny Bones Math
In this Mr. Funny Bones math worksheet, students count the total number of candy bones, sort them into five categories, and graph the number of each kind. Students graph five groups of bones.
Curated OER
Hand Count and Graph Book
In this counting and graphing hands worksheet, students count the number of pictures of hands and graph the total number on the squares at the bottom of each problem. Students solve ten problems.
Curated OER
Graphs and Spreadsheets
Students collect data and present it in a graph and/or a spreadsheet, depending on their previous understanding of technology.
Curated OER
Morning Math
In this math worksheet, 1st graders complete seven exercises reviewing money, addition, subtraction, patterns, and graphs. Two worksheets are included, each containing seven exercises.
Curated OER
Bunny Mix M&M's Math
In this Easter M&M's math activity worksheet, students count their M&M's, sort them by color, make a pattern with them, and create a graph showing how many of each color they have.
Curated OER
M & M Math
Students sort M & Ms by a given attribute, and estimate how many M & Ms are in two bags. They graph their M & Ms and conclude which color they have the most and least of, then students combine sets of M & Ms together and...
Math Drills
Valentine's Day Ordering and Comparing (B)
Discover this Valentine's Day-themed worksheet where young mathematicians answer word problems using data tables.
August House
Why Koala Has a Stumpy Tail
Learn about the animals of Australia with a language arts lesson about an Australian folktale called, Why Koala Has a Stumpy Tail. After reading the story as a class, kids discuss events and characters from the book, retell the...
Math Drills
Valentine's Day Ordering and Comparing (A)
Youngsters use a data table to answer questions, in a Valentine's Day-themed worksheet.
Curated OER
Pet Tally
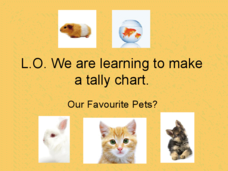
Give the class an opportunity to practice using tally marks as a way to collect data. As you progress through the slide show, learners tally up the number and types of pets they see, they then use their data to create a tally chart....
Curated OER
Sorting Sweethearts
In this holiday worksheet, students estimate how many heart candies are in a cup. Then, students sort their hearts and add up how many are in each color and how many there are total. Students also create a bar graph that displays how...
Curated OER
Community and Me
First and second graders view art work, have group and class discussions, listen to stories, write themes, make notes, conduct interviews, graph results, chart findings, and plan a career day. These ambitious lessons should lead your...
Curated OER
Geometry and Measurement
Young geometers explore relationships between units of measure and objects. Three activities provide varied opportunities to practice. Learners calculate the volume of two cylinders made by rolling a piece of paper vertically and...
National Park Service
Rock Ranking
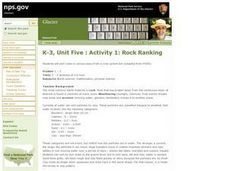
Junior geologists sort rocks and soil. They separate a sample of river gravel by size, shape, color, and other characteristics. To include Common Core standards, you could have little ones graph the number of particles in each sample.
Other popular searches
- Charts and Graphs Math
- Hidden Picture Math Graphs
- Misleading Graphs Math
- Powerpoint Math Graphs
- 1st Grade Math Graphs
- Math Graphs 4th Grade
- Math Reading Graphs
- Animals Math Graphs
- Math Graphs Grade 1
- Creating Math Graphs
- Math Graphs Using M&ms
- Math Interpreting Graphs


