Curated OER
Tracking Fall's Falling Temperatures
Young meteorologists track weather from day to day and record results on graphs, maps, or other places. They see firsthand how weather temperatures trend cooler as fall progresses and practice grade-appropriate skills in geography (map...
Curated OER
Favorite Fruit
In this graphing learning exercise, 1st graders create a bar graph showing the favorite fruits of their classmates. They analyze their bar graph by answering five comprehension questions.
Curated OER
THE EASTER BUNNY GETS READY! PICTURE GRAPH
In this graphing learning exercise, students read a picture graph about colors of Easter eggs and then answer questions about the graph.
Curated OER
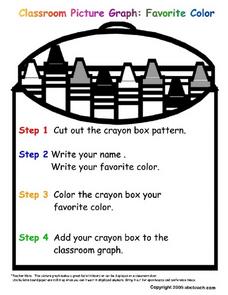
Classroom Picture Graph: Favorite Color
In this picture graph worksheet, 1st graders will cut out a crayon box pattern and write their name and favorite color on it. Then they will color it their favorite color and add to the classroom graph.
Curated OER
Rooster's Off To See the World Number-Sense
Students recognize how numbers are used in number stories. In this Rooster's Off To See the World lesson, students participate in the story. Students complete a number activity and work on the computer to illustrate a number...
Curated OER
Graphs
In this math learning exercise, students practice the activity that is directed by the teacher. The graph is filled with the data and titled at the top of the page.
Curated OER
Do You Wear Glasses?: Graph
In this bar graph worksheet, students will ask their classmates if they wear glasses or not and record the responses to complete the graph.
Curated OER
Compare Sets of Objects Guided Lesson
Practice math vocabulary terms fewer, more, and data using this visual-object-analysis guide. Learners observe three sets of objects and answer three questions, two of which compare numbers of objects, and the last which...
Curated OER
Apple Graphing
Learners sample a variety of types of apples and then survey each other regarding their favorites. They chart how many students prefer each type of apple.
Curated OER
Creating Bar Graphs
Pupils create bar graphs based on the names in their family. In this bar graphs instructional activity, students collect the names of the their family members, graph the names into a graphing computer program, and compare the data with...
Curated OER
Graph It!
First graders use organized data to construct real object graphs, picture graphs, and bar-type graphs.
Curated OER
Girl Scout Cookies Graph
Students graph which girl scout cookies they like the best. They create a Venn Diagram about which one is their favorite. They place cookie shaped cutouts on the correct spot on the graph.
Curated OER
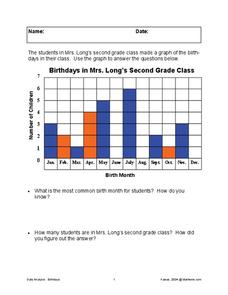
Birthday Graph
In this graphing worksheet, students interpret a graph of "birthdays in Mrs. Long's second grade class" to answer 2 related questions.
Curated OER
Gummy Bear Color Graph
In this graphing worksheet, students see color 5 color words at the bottom of a graph that contains black line pictures of gummy bears. There are no directions or questions given with the graph.
Curated OER
Go The Distance Car Construction
Students build and program a car to drive a specific challenge distance.They must at the end of the lesson, have the car that stops the closest to a challenge distance.
Curated OER
Get Your Pupils Moving While Learning
Use these teaching strategies to get the wiggles out and keep the learning in!
Curated OER
What's Your Favorite Fruit?
A sweet activity to challenge your first graders! The picture graph displays a class's favorite fruits. Young learners solve various problems with the data, including counting the amounts of each kind of fruit, and interpreting which...
Curated OER
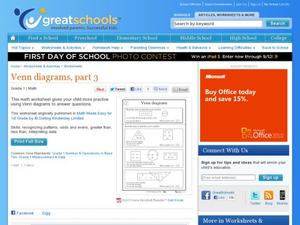
Venn Diagrams, Part 3
Can your first graders interpret Venn diagrams? Different sets of clues help pupils narrow down a specific number in different shapes. They determine odds and evens, greater than or less than, and what shape the number is in. A fun...
Curated OER
Tallies
Tally Marks are a wonderful way to keep track of data, and to foster counting for your young mathematicians. This resource has learners identify the correct number of tally marks for a given number. The numbers used are: 13, 15, 17, and...
Curated OER
Halloween Count and Color #3
Practice counting to 3 and 4 with this Halloween-themed worksheet. You class will count and color different characters, then graph them in the provided chart. Note: An answer key is included.
Curated OER
An Easier Way to Count: Using Groups of 10
Young scholars explore their counting skills. In this counting lesson, students group objects in sets of 10 to practice counting them. Young scholars also practice graphing the sets of objects they count. This lesson...
Curated OER
How Deep Do They Dive
Learners calculate and graph the diving depths of various types of whales. They cut out and glue whale pictures on a worksheet to represent the diving depths for five whales, and discuss how people use graphs to communicate.
Curated OER
Data Lesson Vital Information
Students prepare and collect data and use excel and create a graph. They collect data about the number of pattern blocks that are put on tables. Students then record that data in Excel.
Curated OER
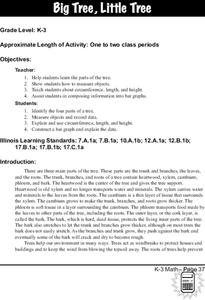
Trees
Students investigate the parts of a tree, measure its circumference and the length and width of its longest branch. The data is compiled and placed into a bar graph.
Other popular searches
- Charts and Graphs Math
- Hidden Picture Math Graphs
- Misleading Graphs Math
- Powerpoint Math Graphs
- 1st Grade Math Graphs
- Math Graphs 4th Grade
- Math Reading Graphs
- Animals Math Graphs
- Math Graphs Grade 1
- Creating Math Graphs
- Math Graphs Using M&ms
- Math Interpreting Graphs


