Curated OER
Bar Charts and Pictographs: How can they help us?
First graders work with manipulatives to solve various math problems by using concrete objects to solve a list of problems . They create and evaluate bar graphs and write a statement about the information on their bar graph.
Curated OER
Collecting Data and Graphing
Students practice collecting and graphing data using interlocking cubes. In this graphing lesson, partners count cubes and graph them. They also use a meter stick to measure arm span and height then compare the results with the class as...
Curated OER
St. Patrick's Day Lucky Charms Sort Bar Graph
In this elementary data collection and graphing worksheet, students paste the correct cereal pieces to match the words at the bottom of the bar graph. They count the items and fill in the graph in this St. Patrick's Day themed activity.
Curated OER
Bar Graphs with Tally Marks
Students classify buttons into categories, create and interpret a tally table and bar graph, and add and subtract numbers.
Curated OER
Thanksgiving Math
In this Thanksgiving theme math practice, students count turkeys and tally. In this fill in the blank worksheet, students find three answers.
Curated OER
Froot Loop Graph
In this froot loops graph instructional activity, students graph the colors of the fruit loops they have. Students graph 6 colors of fruit loops on the graph.
Curated OER
Fall Leaf Graph
In this sorting and graphing fall leaves worksheet, students sort and count the number of leaves in five fall colors and graph the results. Students complete one graph.
Curated OER
100 Fruit Loops Graph
In this graphing Fruit Loops learning exercise, students work in small groups to sort, count, and graph one hundred Fruit Loops. Students graph six colors of Fruit Loops.
Curated OER
Nut Sorting and Graphing
In this sorting and graphing worksheet, 1st graders will sort 3 kinds of nuts: hickory, black walnut, and acorn. Then students will record the amount of each and complete the graph.
Curated OER
Bee Count and Graph Book
In this counting and graphing worksheet, learners count the number of bees on each page and graph the total number counted by filling in the squares at the bottom of each page. Students answer ten problems.
Curated OER
Conversation Hearts Graph: Valentine's Day
In this graphing conversation hearts worksheet, learners sort and count the colors of candy hearts, and determine which color had the most and least numbers. Students answer eight questions.
Curated OER
Apple Graph
Learners sample three types of apples. They choose their favorite apple. They create a graph, charting the favorite apples of their classmates. They answer a series of questions.
Curated OER
Counting
First graders explore collecting data. They collect data using a data collection sheet and enter the data into Excel. Students create graphs using Excel. They share their graphs with the class.
Curated OER
Generate Measurement Data Word Problems
Using a set of simple data, learners create a line plot to organize the information. This data includes only single-digit numbers and the highest number is six. Because the answer is explained and illustrated at the bottom, project this...
Curated OER
Can You Count on Cans?
How can a canned food drive be connected to math? It's as simple as counting and organizing the cans! Children demonstrate their ability to sort non-perishable foods into categories that include soup cans, vegetable cans, boxed items,...
Curated OER
Look Into My Eyes!
Students explore collecting, analyzing, and graphing information. They collect data on the various eye colors of their classmates. Students tally the results and create a graph.
Curated OER
Fall Leaves
In this fall leaves worksheet, students identify the colors of leaves and determine the number they have of each. This worksheet may be used in elementary grades, for color identification and counting purposes. For the middle school...
Curated OER
Twelve Days of Christmas--Prediction, Estimation, Addition, Table and Chart
Scholars explore graphing. They will listen to and sing "The Twelve Days of Christmas" and estimate how many gifts were mentioned in the song. Then complete a data chart representing each gift given in the song. They also construct...
Curriculum Corner
Our Classroom Birthdays
Combine getting to know one another and math with a worksheet that focuses on graphing birthdays. Scholars collect data to discover how many peers share birthday months and fill in a bar graph for visual representation.
K20 LEARN
Comparing Numbers And Fruit—More Or Less: Comparing Numbers
A discussion begins a lesson on comparing numbers. Pupils explain how they can show a number, then visit math centers to explore number-making tools. A story read-aloud of More or Less by Stuart Murphy identifies language for...
Curated OER
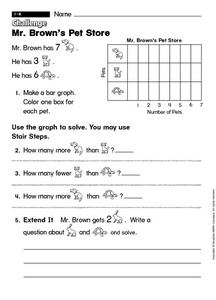
Mr. Brown's Pet Store
In this early childhood problem solving worksheet, students make a bar graph with the provided information and then use the graph to solve 4 problems.
Curated OER
Counting Votes
Here's a great way to combine a good class discussion on nutrition with math. A class discussion on what can be made from vegetables is held, then learners all vote for their favorite vegetable. A graph is produced that shows the...
Curated OER
Kids/Blocks/Learning
Help develop graphing skills in your young learners.. They create a picture graph, represent 1:1 correspondence, represent same and different, and draw conclusions. They write an experience story about the conclusions drawn from the...
Curated OER
Class Color Count
Students use the internet to research when different groups of people received the right to vote in the United States. As a class, they hold an election to determine the favorite color of the class. To end the lesson, they take the...
Other popular searches
- Charts and Graphs Math
- Hidden Picture Math Graphs
- Misleading Graphs Math
- Powerpoint Math Graphs
- 1st Grade Math Graphs
- Math Graphs 4th Grade
- Math Reading Graphs
- Animals Math Graphs
- Math Graphs Grade 1
- Creating Math Graphs
- Math Graphs Using M&ms
- Math Interpreting Graphs


