Curated OER
If Our Class Went to See the Prince
First graders read the story One Monday Morning and create picture graphs based on the number of teachers, boys, and girls that would visit the prince. In this data lesson plan, 1st graders interpret tables and graphs with the help of...
Curated OER
Pancakes, Anyone?
First graders explore data collecting and graphing. In this data collecting and graping lesson, 1st graders watch a video about monster who sells pancakes. Students make a graph to record the most popular pancake. Students also play...
Curated OER
Count On It!
Students investigate money. In this consumer math lesson, students use coins, identify their value, then group them in various ways to equal a dollar.
Curated OER
The Air Up There
In this data collection and analysis lesson, learners observe and graph the weather conditions during one school week, then calculate the average weather temperature. Extensions are included.
Curated OER
Valentine Candy Count
Students investigate what color Valentine Candy is found more often than any other in a standard bag of "Valentine Conversation Hearts." They sort, classify and graph their findings.
Curated OER
Algebra: Co-ordinates
Students use Cartesian coordinates. In this graphing lesson students use simple formulae, interpret coordinates, and create graphical representations. They express their work algebraically.
Curated OER
Valentine Candy Count
Here is an imaginative take on a classic lesson! Young scholars discover what color Valentine Candy is found more often than any other in a standard bag of Valentine Conversation Hearts. They observe, predict, sort, and classify the data...
Curated OER
How Do You Get Home from School?
First graders create pictographs and interpret results of transportation home from school.
Curated OER
How Do You Feel Today?
Students create a graph, then listen to Dr. Seuss' book, My Many Colored Days. After the story, they do a similar graph and then compare the two graphs.
Curated OER
Jelly Belly: What a Wonderful "Bean"!
Students explore how jelly beans are produced. They discuss the origins of the jelly bean and view a video about how jelly beans are prepared, tested, shaped, finished, and shipped and estimate the amount of jelly beans in a jar and sort...
Curated OER
Weather Report Chart
Students complete a weather report chart after studying weather patterns for a period of time. In this weather report instructional activity, students measure temperature, precipitation, cloud cover, wind speed, and wind direction for a...
Curated OER
Spring Potted Plants
Students identify and interpret plant growth as well as gain graphing skills and other important knowledge related to potting plants. They take a regular milk jug and cut off the top, leaving the handle and the rest intact. Then,...
Curated OER
Potential Energy: How is It Related to Kinetic Energy?
Students explore kinetic and potential energy. In this energy lesson, students launch toys cars from ramps in order to examine the relationship between potential energy and kinetic energy. Students collect data and graph the results.
Curated OER
Adaptive Worksheet: Counting 1-5
In this adaptive counting worksheet, students interpret a simple graph, counting the number of oranges 4 children have and recording each. A reference website for additional resources is given.
Curated OER
Down by the Bay
Students listen to teacher read books about fish and participate in activities in order to explore how to identify bluefish. They count and graph the numbers of fish they find in simulated fishing activities.
Curated OER
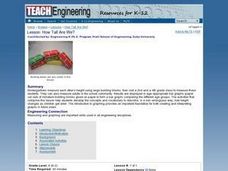
How Tall Are We?
Students in a Kindergarten class measure each other's height using large building blocks and then visit a 2nd and a 4th grade class to measure those students. They display the results in bar graphs, comparing the different age groups.
Curated OER
Awesome Animals
Students collect data from classmates about their favorite animal. They use the ClarisWorks graphing program to enter data, graph results, and interpret data.
Curated OER
Save Me: Mother Earth
Students read stories and articles about protecting the Earth. They collect data for a computer generated graph, and provide a key to show what the symbols represent.
Curated OER
To Classify Beans And Peas
First graders record information on a bar graph and interpret the information given. They identify five different kinds of beans and three different kinds of peas. They work in groups of four and sort the beans by size or shape.
Curated OER
On Our Way to School
First graders create a class graph that illustrates how they get to school and interpret data from the graph. They complete an assessment worksheet independently and answer questions about the graph shown.
Curated OER
What's Your Expression
First graders explore facial expressions in a mirror and create drawings of people with a facial expression of their choice. They graph the facial expressions drawn.
Curated OER
Applemania
First graders read "Ten Apples Up On Top!" and view real apples in a basket. They taste different kinds of apples and describe the tastes: sour, sweet, etc. They graph everyone's favorite apple. They interpret the graph and draw their...
Curated OER
Do You Have a Coin Collection?
Learners create a graph showing which young scholars in the class collect coins.
Curated OER
What's Cooking at the Good Times Cafe?
Students collect data from classmates showing their favorite lunch food. They enter their data and graph the results using a computer program.


