Curated OER
Bar Charts and Pictographs: How can they help us?
First graders work with manipulatives to solve various math problems by using concrete objects to solve a list of problems . They create and evaluate bar graphs and write a statement about the information on their bar graph.
Curated OER
Bar Graphs with Tally Marks
Students classify buttons into categories, create and interpret a tally table and bar graph, and add and subtract numbers.
Curated OER
Twelve Days of Christmas--Prediction, Estimation, Addition, Table and Chart
Scholars explore graphing. They will listen to and sing "The Twelve Days of Christmas" and estimate how many gifts were mentioned in the song. Then complete a data chart representing each gift given in the song. They also construct...
Curated OER
Statistics and Probablility
Statistics and Probability are all about collecting, organizing, and interpreting data. Young learners use previously collected data and construct a picture graph of the data on poster board. This stellar instructional activity should...
Curated OER
Gummy Bear Picture Graph
First graders investigate picture graphs. In this graphing lesson, 1st graders create a picture graph with the x-axis being number and the y-axis being color. Students sort their gummy bears by color and use pictures of colored bears...
Curated OER
Handling Data
Learners create a simple table in order to solve a problem. As a class, they create a simple data table in order to discover the number of letters in each student's name. This data is interpreted in order to answer questions and make...
Curated OER
Graphing Favorite Holidays
Students create spreadsheets and bar graphs based on results of survey of favorite holidays.
Curated OER
Graphing : research and record information
First graders create graphs. In this graphing lesson plan, 1st graders create a floor graph using their bodies to record information. They create picture graphs after collecting information.
Curated OER
Bar Graph Activity-Kindergarten
In this bar graph learning exercise, learners interpret a bar graph, writing how many students like each given flavor of ice cream. A reference web site is given for additional activities.
Curated OER
Growing and Graphing
Learners visit a 2nd and a 4th grade class to measure the heights of older students using large building blocks as a non-standard unit of measure. They can also measure adults in the school community. Results are displayed in...
Curated OER
Dental Detectives
First graders explore the theme of dental health and hygeine. They make tooth loss predictions, count lost teeth, and graph tooth loss. In addition, they listen to dental health stories, read online stories, create spreadsheets, and play...
Curated OER
Chicken Pox Math
Students will listen to a story of a boy with chicken pox and participate in a class discussion of chicken pox and what to do when you have a contagious disease. They will incorporate math by graphing who in the class has had the...
Curated OER
Reading the Neighborhood
First graders complete activities with the story One Monday Morning in the Macmillan/McGraw Hill Textbook. In this data lesson, 1st graders read the story and gather data to create a picture graph. They read the graph and answer...
Curated OER
Birthday Graph
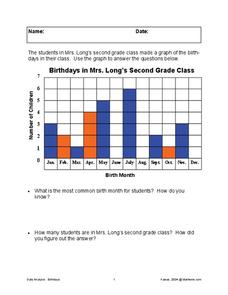
In this graphing worksheet, students interpret a graph of "birthdays in Mrs. Long's second grade class" to answer 2 related questions.
Curated OER
Valentine Candy Count
Students analyze a bag of Valentine candy to create a graph. In this graphing lesson, students make predictions, sort by color, record data and make a graph. Students discuss results and make generalizations. Students generate their own...
Curated OER
Patterns Here, There and Everywhere
Pattern recognition is a skill often used in mathematics. Learners count and sort manipulatives, organize the data into a graph and answer questions about the information displayed. They collect the objects to be used and create patterns...
Curated OER
Technology Literacy Challenge Grant Learning Unit
First graders explore counting and classification. They sort leaves, create graphs, write sentences for the data in the graphs, develop graphs for shapes, favorite animals, birthdays, and participate in a die prediction game.
Curated OER
Tracking Olympic Gold!
Learners use print or online resources to track the results of the Olympic Games, record daily results on graphs, use graphs to collect information.
Curated OER
Zoo Favorites
First graders construct a class picture graph and tally grid that show their favorite zoo animals. They discuss the information the graphs show and complete a personal graph based on the class example.
Curated OER
Graph Your Foot!
Students measure their own foot and place the outline on a graph. They make connections between the size of their foot and the bar graph that represents it.
Curated OER
3-D Beginning Graphs
Students explore the concept of big and small. They collect objects from the classroom, sort them by size, and create a graph using Duplo stacking blocks.
Curated OER
Graph It
First graders collect classroom data (such as mode of transportation used to get to school) and prepare a pictograph to interpret the information.
Curated OER
Recording Frequency
First graders analyze nursery rhymes and gather data about word frequency. For this frequency lesson, 1st graders create graphs and tables. Students interpret the data.


