Curated OER
Manatee Awareness Survey
Students examine the public's awareness of manatees by taking a survey. They display the results of the survey as a graph.
Curated OER
Growing Up With A Mission
Student measure heights and graph them using growth charts for which they find the mean, mode, and median of the data set. They graph points on a Cartesian coordinate system.
Curated OER
Using Computer for Statistical Analysis
Students examine the use for spreadsheets in analyzing data. They make spreadsheets that display and calculate a given data set such as temperature change.
Curated OER
Time, Tide, and Quahogs
Students read tide tables for Waquoit Bay as the simulate determining the best time to go clam digging for a Wampanoag clambake. They graph the tide tables while realizing that the tides a Waquoit Bay are one hour later than those at...
Curated OER
Probability of a Boy
Students investigate the concept of even change by participating in a coin flip activity. They research using the Internet to investigate the chance of giving birth to a boy.
Curated OER
Tourism in London
Students discuss the tourist attractions that are in London. They examine how data can be manipulated by completing a worksheet. They plan a trip to a London attraction after conducting Internet research.
Curated OER
What Does Your School Think of Fair Trade?
Students design and conduct a survey in order to assess the local opinion and knowledge regarding Fair Trade chocolate. They use the results to design a Fair Trade promotion at school.
Curated OER
Watermelon Math
Students compute the mean and median of the number of seeds in a watermelon. They work in groups with a slice of water to complete and compare their calculations. They get a class average and mean.
Curated OER
Kansas Foods A Data and Probability Investigation
Students study a number of food products and anticipate which are derived from Kansas crops. They make a list of words associated with the food stuffs and graph the results.
Curated OER
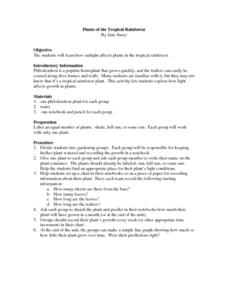
Plants of the Tropical Rainforest
Students experiment with the growth of philodendron plants in different amounts of sunlight. They complete a gardening notebook including plant sketches and growth data.
Curated OER
Design, Spin, and Graph
Students participate in a spinner activity and graph the results. They spin 10 times, tally the results, and discuss why the results occurred.
Curated OER
ExplorA-Pond:3rd Grade Probability
Third graders cut a map of a pond into grid squares. They count the total number of squares and calculate the probability of drawing a pond piece vs. a shoreline piece. They draw 10 pieces and compare the results with the original...
Curated OER
Centennial: Secrets From Beyond...
Fourth graders identify cemeteries as a source of information for historical research. They consider the types of information cemeteries can provide, review local headstones and create a database of the collected knowledge.
Curated OER
Code Breakers
Students collect data and make a frequency table, change ratios into percents, and analyze data to make predictions.
Curated OER
Probability Using M & M's
Students develop an understanding of probability by sorting bags of M & M's by color and recording the results in percents. The data is entered onto a spreasdsheet and graphed.
Curated OER
Statistical Specimens
Third graders are introduced to statistical vocabulary. They complete an online activity that asks them to calculate the mean, median and mode for a set of data.
Curated OER
Probability or Ability?
Students fill in a probability chart while attempting to catch candy with their non-dominant hands. They replicate the activity with a coin.
Curated OER
Probability or Ability?
Pupils toss candy and coins using their non-dominant hand while their partners records the results on a probability charts.
Curated OER
Probability or Ability?
Students use their non-dominant hand to catch candy which they tossed in the air. They estimate how many they catch in a second round. They record and determine how the probability changed the second time.
Curated OER
Using Statistics to Uncover More Evidence
Fifth graders participate in an online Web lesson plan on ways of interpreting data. They conduct a survey and interpret the results in a journal entry.
Curated OER
Chesapeake Bay Population Studies
Learners use quarter meter2 quadrant to determine population density, relative density, frequency, relative frequency, calculate diversity index, and establish correlation of association between any two species.
Curated OER
Drawing Conclusions
Students play a probability game, then design and complete a probability problem concerning changing odds.
Curated OER
Lucky Number
Students use data from simulations to make theoretical generalizations. They discuss possible relationships between several given events and gain understanding about their own mathematical intuition about likelihood.
Curated OER
Efficiency Means Getting More for Less
Students measure water and make predictions about efficiency.


