Curated OER
Applied Science - Science and Math Lab
Students make a prediction. In this applied science lesson, students guess the number of items in a jar. Students create a bar graph to show the predictions and the actual amounts.
Curated OER
Graphing
Students investigate graphing. In this bar graph lesson plan, students view an informational website about graphing, then construct a class birthday bar graph outside with sidewalk chalk. Students choose a survey topic, then collect...
Curated OER
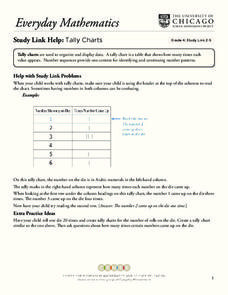
Tally Charts
In this tally charts worksheet, learners discuss how to use a tally chart and how to read the chart. Once students record information on a tally chart they answer questions showing their ability to read a tally chart.
National Security Agency
Starting a Restaurant
Through an engaging unit, chefs-in-training will sort and classify data using tally charts. Learners will also create bar graphs to display restaurant data and interpret data from bar graphs using a variety of categories. This is a fun...
Curated OER
Weather Calendar
In this weather calendar worksheet, students read the calendar and identify the type of weather that occurred on that date. They also determine the total number of days that were cloudy, sunny, etc. There are 9 questions on this...
Curated OER
Creating Bar Graphs and Pie Graphs
Second graders observe a demonstration of the creation of a bar graph and a pie graph of their favorite colors. They gather information about various topics from their classmates, then organize the information, creating a bar and a pie...
Curated OER
Tally Charts
In this tally charts worksheet, students fill in the tally chart with the item, tally, and number. Students have 2 tally charts to complete.
Curated OER
Graphing Pockets
Second graders explore graphing. They count the number of pockets on their clothes and use Microsoft Excel to enter their data. Students create a class graph displaying their findings.
Curriculum Corner
Second Grade Summer Math Practice Book
Stop the summer lag with a set of second grade Common Core based math practice sheets. Learners fill in hundreds charts with missing numbers up to 1,000. They practice writing numbers in standard, expanded, and word form. Children also...
Curated OER
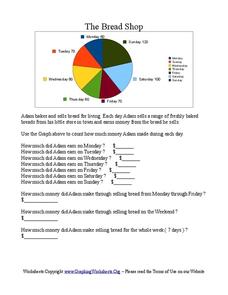
The Bread Shop
In this pie chart worksheet, students use the pie chart graph to count the money Adam made in the Bread Shop. Students complete 10 questions.
Curated OER
Graphing Favorite Holidays
Students create spreadsheets and bar graphs based on results of survey of favorite holidays.
Curated OER
Graphing Family Reading Habits
Second graders collect data from their families about their reading habits and graph them. For this graphing family reading habits lesson, 2nd graders interview family members about their reading habits. They then use a graphing computer...
Curated OER
Dynamite Data
Second graders rotate through a variety of stations designed to offer practice in manipulating data. They sort, tally and count items and then create bar graphs, tables, and pie graphs to record their findings.
Curated OER
SkittleGraphs
Second graders discover how to make a bar graph. Each student receives a bag of Skittles candy. They make a bar graph which documents the colors found in the bag. At the end of the lesson plan, the Skittles are eaten. Fun!
Curated OER
Graphing Our Favorite Candy Bars
Learners use ClarisWorks to graph class' favorite candy bars on a bar graph.
Curated OER
French Fry Run
Student explore estimation and measurement. In this measurement lesson, 2nd graders measure french fries, graph their data, and determine the size of french fries that is the best value. Students practice how to add prices and calculate ...
Curated OER
Counting
Second graders comprehend how to use two different kinds of graphs. They complete a worksheet with the help of the teacher and a bag of jellybeans and then another worksheet without the direction of the teacher. Students listen as the...
Curated OER
Generate Measurement Data Word Problems
Plot data for three word problems, each with a table of data. Learners create line plots for these, all of which have only single-digit whole numbers. The large text and few number of problems make this ideal as a whole-class warm up....
Curated OER
Data Analysis: For Little Learners
Using pictographs, tally charts, and surveys, kids learn all about data analysis and collection. They make surveys, collect data, then construct pictographs and tally charts to organize their information.
Curated OER
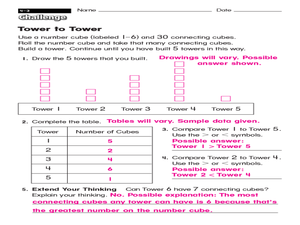
Building Towers with Number Cubes
In this building towers with number cubes worksheet, 2nd graders build number cube towers by rolling a dice, then complete a data chart to compare the number of cubes in each tower.
Curated OER
Santa's List Sums (G2)
In this Christmas math activity, students help Santa know the number of children on the given streets in the chart. Students find the sum of the boys and girls for the 17 problems.
Curated OER
Cindy and Linda - Selling Lemonade
In this pie charts activity, students use the pie chart to count how many glasses of Lemonade were sold by Cindy and Linda. Students complete the table and answer 3 questions.
Curated OER
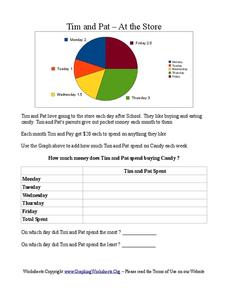
Tim and Pat - At the Store
In this pie chart worksheet, students use the pie chart to add the amount of time Tim and Pat spend buying candy each day of the week. Students answer 2 questions about the table.
Other popular searches
- Pie Charts and Graphs
- Reading Charts and Graphs
- Behavior Charts and Graphs
- Charts and Graphs Candy
- Interpret Charts and Graphs
- Charts and Graphs Christmas
- Charts and Graphs Math
- Analyzing Charts and Graphs
- Tables, Charts and Graphs
- Charts and Graphs Europe
- Using Charts and Graphs
- Bar Graphs and Charts


