Curated OER
Tables
Can you read this table? Learners begin to comprehend data analysis through examining two simple tables and answering comprehension questions. The first gives characteristics about three animals in yes-or-no format (i.e. "eats insects,"...
Curated OER
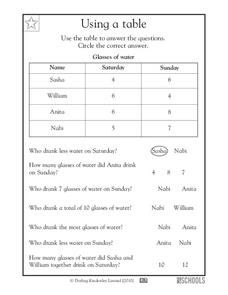
Using a Table
Tables are no help if your scholars can't read them; provide some excellent beginner-practice using this table example and accompanying comprehension questions. Learners examine the data first, which charts the number of glasses of water...
Curated OER
Reading Tables
Who is two years younger than Meg? Who is older than Paul, but not Kinta? Scholars practice reading tables as they answer comprehension questions based on three sets of data. First, they examine a table depicting ages, then favorite...
Curated OER
Are You Full of Hot Air?
Explore the concept of measuring and recording circumference. In this physical science and measurement lesson, young learners blow up balloons, measure the circumference, and record the data on an interactive graphing website.
Curated OER
A Day at the Beach
Let's go to the beach! Danielle, Marty, and Phil collected shells at the beach. Can you determine how many shells each child has? Create a picture graph to make the data easier to understand.
Math Drills
Valentine's Day Ordering and Comparing (A)
Youngsters use a data table to answer questions, in a Valentine's Day-themed worksheet.
Curated OER
Handling Data
Students create a simple table in order to solve a problem. As a class, they create a simple data table in order to discover the number of letters in each student's name. This data is interpreted in order to answer questions and make...
Curated OER
What's Data?
Students get the opportunity to investigate the concept of data collecting. They explore how to tally and read a bar graph. Vocabulary about data is also be included. At the end of the instructional activity, individual students collect...
Curated OER
Generate Measurement Data Word Problems
Plot data for three word problems, each with a table of data. Learners create line plots for these, all of which have only single-digit whole numbers. The large text and few number of problems make this ideal as a whole-class warm up....
Curated OER
Twelve Days of Christmas--Prediction, Estimation, Addition, Table and Chart
Scholars explore graphing. They will listen to and sing "The Twelve Days of Christmas" and estimate how many gifts were mentioned in the song. Then complete a data chart representing each gift given in the song. They also construct...
Curated OER
Counting Coins
Second graders identify a quarter, dime, penny, nickel, and dime. They match the coin with it's monetary value, collect data on excel spreadsheet, and create a graph in Excel. Students participate in group activities.
Curated OER
Bar Graphs
What are these bar graphs depicting? Novice data analyzers examine two basic bar graphs and answer three comprehension questions about each. The first graph shows tickets sold per date and the next is distances run per member of a cross...
Curated OER
Graph Those Stickers!
Students graph fruit. In this graphing lesson students create a graph using fruit label stickers. Students place a sticker on the graph when the fruit has been consumed.
Heidi Songs
Zoo Animal Probability Graph
Capture the engagement of your young mathematicians with a collaborative graphing activity. Using a deck of zoo animal picture cards, students select a picture from the deck, record the chosen animal on a graph, and then replace the card...
Curated OER
Dynamite Data
Second graders rotate through a variety of stations designed to offer practice in manipulating data. They sort, tally and count items and then create bar graphs, tables, and pie graphs to record their findings.
Curated OER
Holiday Tally
In this tally chart instructional activity, students ask ten friends which of 3 holidays they like best. Students create a tally chart with their results and answer 6 questions.
Curated OER
Data Lesson Vital Information
Young scholars prepare and collect data and use excel and create a graph. They collect data about the number of pattern blocks that are put on tables. Students then record that data in Excel.
University of Kansas
Newspaper in the Classroom
Newspapers aren't only for reading—they're for learning skills, too! A journalism unit provides three lessons each for primary, intermediate, and secondary grades. Lessons include objectives, materials, vocabulary, and procedure, and...
National Security Agency
Starting a Restaurant
Through an engaging unit, chefs-in-training will sort and classify data using tally charts. Learners will also create bar graphs to display restaurant data and interpret data from bar graphs using a variety of categories. This is a fun...
Living Rainforest
Finding the Rainforests
From Brazil to Indonesia, young scientists investigate the geography and climate of the world's tropical rain forests with this collection of worksheets.
Curated OER
Color Tile Graphing
Students explore data. They gather data and generate questions about the data in pictographs, tallies, tables, and bar graphs. Students use color tiles pulled by random to create their own bar graph. They discuss the bar graphs they...
Curated OER
Graphing Family Reading Habits
Second graders collect data from their families about their reading habits and graph them. For this graphing family reading habits lesson, 2nd graders interview family members about their reading habits. They then use a graphing computer...
Curated OER
Weathervanes in the Wind
Students investigate wind and weather by creating a weathervane. In this environment instructional activity, students identify the purpose of a weathervane and observe weathervanes in action on their campus. Students create a...


