Scholastic
Study Jams! Line Plots
Data analysts are guided through the arrangement of whole-number data onto a line plot by listening and viewing a high-quality, animated, and narrated set of slides.
Curated OER
Custom Line Plot Worksheets
Do you need to create custom line plot worksheets for your math learners? Use this template to create the line plot. Include up to five questions below the plot.
Curated OER
Line Plot Touchdowns
In this line plots worksheet, students read the number of touchdowns that were scored in Super Bowl Games from 1990-2000. Students use the line plots to answer the questions.
PBS
Button, Button
Youngsters count, classify, and estimate quantities using buttons after a read aloud of The Button Box by Margarette S. Reid. They discuss the difference between guessing and estimating. Based on an experiment, they predict the number of...
Illustrative Mathematics
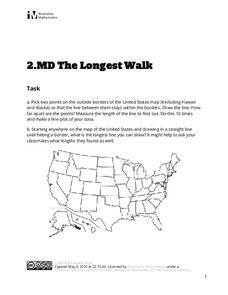
The Longest Walk
How long of a line can you draw within this activity? Learners pick two points outside and within the map to create the longest line they can. After drawing 10 lines, learners plot the length of each line on a line plot. Then they...
Curated OER
Generate Measurement Data Word Problems
Plot data for three word problems, each with a table of data. Learners create line plots for these, all of which have only single-digit whole numbers. The large text and few number of problems make this ideal as a whole-class warm up....
Curated OER
Generate Measurement Data Word Problems
Using a set of simple data, learners create a line plot to organize the information. This data includes only single-digit numbers and the highest number is six. Because the answer is explained and illustrated at the bottom, project this...
Curated OER
Points on a Line
Get your learners up and moving, all while reviewing numbers on the number line! For this activity, learners are grouped in teams outdoors. The teacher will have already created number lines on the ground (with chalk, tape, etc.), and...
Illustrative Mathematics
Growing Bean Plants (Grade 2)
After planting a bean seed in a jar, young scientists observe the growth patterns over several days. As the bean becomes a sprout, and the sprout becomes a plant, partners measure and plot the data. They notice patterns, practice...
Curated OER
Connecting With Coordinates
Play a coordinates game to encourage collaborative learning and grid use! Learners plot points on grids and play a game that challenges them to locate a specific point on a coordinate grid by using horizontal and vertical movements.
Illustrative Mathematics
Hand Span Measures
How long is your hand span? Young mathematicians measure their hand span from pinky tip to thumb tip using a centimeter ruler. After rounding to the nearest whole centimeter, learners plot their data on a line plot.
Curated OER
Generate Measurement Data Word Problems
Bar and line graphs are an excellent way to visually analyze data: give your scholars practice both analyzing graphs and creating their own! First, they examine five basic bar graphs, indicating the number of squares on specific days....
Curated OER
Bar Graphs
Introduce scholars to bar graphs and data analysis through analyzing these visual examples. First, they look at a pictograph of fruit types and answer five observation questions. There is one done for them as an example. Learners do the...
Curated OER
Use a Graph
Information is often presented in graph form. Can your youngsters read a basic bar or picture graph? Six word problems accompany three graphs. One graph is a bar graph and the other two are pictographs.
Curated OER
RCX Car Line Graph
Young scholars develop a line graph based on distances that an RCX car drives in specified amounts of time. They then are given a specific amount of time for the car to drive and be asked to extrapolate the car's distance from the graph.
Curated OER
Number Line Worksheet
For this math worksheet, students examine 5 portions of number lines between 20 and 50. Only a few intervals are marked with number labels. Students answer 5 questions about the number lines and the points plotted on them.
Curated OER
Go The Distance Car Construction
Young scholars build and program a car to drive a specific challenge distance.They must at the end of the lesson, have the car that stops the closest to a challenge distance.
K-5 Math Teaching Resources
Graph Paper
You'll never have to buy graph paper again with this printable resource, which can be used for anything from creating graphs, plotting points in the coordinate plane, or measuring the area and perimeter of polygons. A helpful resource...
Curated OER
Graphing Toys!
Jason, Michelle, Sofia, and Willis all have a variety of toys. Use the chart provided to graph how many toys each child has. Who has the most toys? Who has the least? Help your learners study the graphs they create to better understand...
Curated OER
When Ants Fly
Here is a great lesson on constructing line graphs. Learners identify common characteristics of birds, ants common needs of all living things. They also write a story from the perspective of an ant or a bird that has lost its home and...
Curated OER
Geometry and Measurement
Young geometers explore relationships between units of measure and objects. Three activities provide varied opportunities to practice. Learners calculate the volume of two cylinders made by rolling a piece of paper vertically and...
Curated OER
"M&M's"® Candies Worksheet 2
In this math worksheet, students plot the mean, median, and mode for the colors of M and M candies by filling in the graphic organizer.
Curated OER
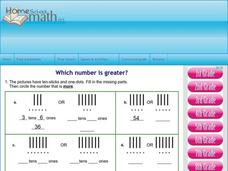
Which Number is Greater?
Students draw pictures of two digit numbers to identify the greater value. In this math lesson, students plot two digit numbers on a number line and identify the greatest or lesser value. Students use the greater than and less than...
Curated OER
Generate Measurement Data Word Problems
Beginning graphers will appreciate this practice with basic bar graphs. For each table of data, there is a corresponding graph for learners to match it to. The five data sets all have the same two factors: days and numbers. Although this...
Other popular searches
- Line Plot Worksheets
- Frequency Tables Line Plots
- Line Plot Graphs
- 1st Grade Line Plot
- Free Line Plot
- Line Plot Pictures
- Frequency Table Line Plot
- Plot Line
- Line Plots Grade 3
- Scatter Plot Trend Line
- Line Plot Outliers
- Fraction Line Plot


