Curated OER
Clouds
Students explore basic cloud types and the weather associated with each one. In this earth science instructional activity, students participate in numerous activities including going outside to observe the clouds they see, making a...
Curated OER
Handling Data
Young scholars create a simple table in order to solve a problem. As a class, they create a simple data table in order to discover the number of letters in each student's name. This data is interpreted in order to answer questions and...
Curated OER
Charting Animal Life Spans
Second graders research animal life spans and complete related math activities. In this life span lesson plan, 2nd graders read How Many Candles and discuss life spans. Students arrange animal cards based on their life spans. Students...
Curated OER
Birthdays
Learners collect data about the birth months of each classmate using a calendar. They make a table with the information before designing a pictograph using cupcake images. They answer questions using the graph.
Curated OER
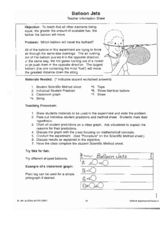
Balloon Jets
Students investigate how fuel amount affects the distance traveled by balloons. In this physics lesson, students collect data and create a pictograph. They interpret data and formulate a conclusion.
Curated OER
SkittleGraphs
Second graders discover how to make a bar graph. Each student receives a bag of Skittles candy. They make a bar graph which documents the colors found in the bag. At the end of the lesson, the Skittles are eaten. Fun!
Pennsylvania Department of Education
Up on Top
Students make bar graphs and identify items in the bar graphs as being likely, certain, or impossible. In this bar graphs lesson plan, students answer questions about the bar graphs using reasoning and communication skills.
Curated OER
Trash Count
Young scholars identify pollution around their local community. They discuss the sources of polution and categorize objects based on their properties. They discover ways to make changes to the environment and how to inform the public.
Curated OER
Graphing Data
Second graders examine how to make and read bar graphs. In this bar graph instructional activity, 2nd graders compare bar graphs to pictographs by looking at hair color survey data. They practice making a bar graph and finding the range...
Curated OER
Boats Graph
Pupils read from the Bible about the travels of Paul, particularly the boat rides. They trace Paul's travels on a map of Asia Minor. Students review a field trip they took and make a graph showing the numbers of each type of boat they...
Curated OER
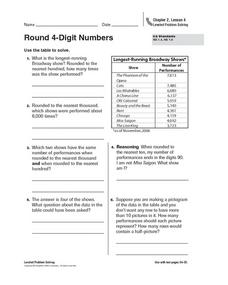
Round 4-Digit Numbers
In this rounding numbers practice worksheet, students sharpen their problem solving skills as they solve 6 story problems that require them to round 4-digit numbers.
Curated OER
Build a Bar Graph
Learners discover how to use bar graphs. They will gather and organize specific data in order to put it into a bar graph. Then they will answer several questions based on the information they have graphed.
Curated OER
George Washington Carver and Sharing
Young scholars research George Washington Carver. In this science instructional activity, students discuss George Washington Carver's contribution to science. Young scholars explain how peanut butter is produced.
Curated OER
What's Data?
Students get the opportunity to investigate the concept of data collecting. They explore how to tally and read a bar graph. Vocabulary about data is also be included. At the end of the instructional activity, individual students collect...
Curated OER
Graphing Data
Second graders graph data about their classmates. In this data analysis lesson, 2nd graders ask each other several questions about their hair color and eye color. Students graph the data that they collected.
Curated OER
Where Do I Fit on the Graph?
Students collect data and create graphs about themselves, their community, and the world around them. They use a variety of methods to organize data, such as stickers, clothespins, name tags, coloring, tally marks, etc.
Curated OER
Jack and the Beanstalk Math
Students listen to Jack and the Beanstalk and determine what they think are the most common words. In this Jack and the Beanstalk lesson plan, students reread the story, count the words they chosen and graph those words. Students graph...
Curated OER
Cars on the Curve
Second graders, using two dice, participate in a car race game called Cars on the Curve. They predict which car wins the game and records it in their Data Diary.
Curated OER
Graphing
Students investigate graphing. In this bar graph lesson plan, students view an informational website about graphing, then construct a class birthday bar graph outside with sidewalk chalk. Students choose a survey topic, then collect...
Curated OER
Drawing Bugs Game
Second graders explore probability by playing a drawing game with dice. After they roll a die, they draw a tree diagram to illustrate each of the possible outcomes.
Curated OER
How Long? How Wide?
Second graders distinguish between and use nonstandard and standard units of measurement, use appropriate tools and techniques to measure length and width, and record and interpret data using graphs.
Curated OER
Neighborhoods
Students examine homes around the world. In this multicultural lesson, students read the book A World of Homes and Homes Around the World. Students compare and contrast the homes in the books to their own homes. Students construct a...
Curated OER
Touch and Discover
Students identify the physical properties of items using the sense of touch. In this touch and discover lesson, students describe items. Students sort items using a Venn diagram.
Curated OER
Tally Time
Students create a tally chart. In this math and health lesson plan, students discuss healthy foods and create a tally chart showing the number of students who like to eat healthy foods.


