Curated OER
Cars on the Curve
Second graders, using two dice, participate in a car race game called Cars on the Curve. They predict which car wins the game and records it in their Data Diary.
Curated OER
Jack and the Beanstalk Math
Students listen to Jack and the Beanstalk and determine what they think are the most common words. In this Jack and the Beanstalk lesson, students reread the story, count the words they chosen and graph those words. Students graph the...
Curated OER
Does One Tree a Forest Make?
Students take a walk around the schoolyard looking at and identifying the trees. One leaf for each tree is collected. A chart is developed that represents the population of trees on the school ground. They keep journals and write an essay.
Curated OER
Drawing Bugs Game
Second graders explore probability by playing a drawing game with dice. After they roll a die, they draw a tree diagram to illustrate each of the possible outcomes.
Alabama Learning Exchange
The Grouchy Ladybug
Learners listen to the book, "The Grouchy Ladybug" by Eric Carle and sequence the events in the story. Using a graph, they draw and color the animals that the ladybug meets next to the corresponding time from the story, and conduct...
Curated OER
Graphing
Students investigate graphing. In this bar graph lesson, students view an informational website about graphing, then construct a class birthday bar graph outside with sidewalk chalk. Students choose a survey topic, then collect data and...
Curated OER
Handling Data
Students create a simple table in order to solve a problem. As a class, they create a simple data table in order to discover the number of letters in each student's name. This data is interpreted in order to answer questions and make...
Curated OER
How Long? How Wide?
Second graders distinguish between and use nonstandard and standard units of measurement, use appropriate tools and techniques to measure length and width, and record and interpret data using graphs.
Curated OER
Yummy Apples!
Learners discuss apples and how they are grown. They listen as the teacher reads "Apples," by Gail Gibbons. Students discuss the story. They view several different types of apples and compare their characteristics. Learners taste several...
Curated OER
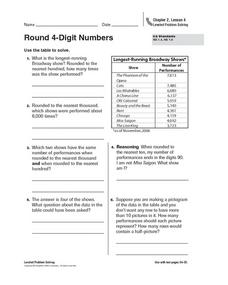
Round 4-Digit Numbers
In this rounding numbers practice worksheet, students sharpen their problem solving skills as they solve 6 story problems that require them to round 4-digit numbers.
Curated OER
Away We Go!
Students study types of transportation. In this transportation lesson, students survey several classes to gather data on how they get to school. Students create a transportation graph.
Curated OER
Neighborhoods
Students examine homes around the world. For this multicultural lesson, students read the book A World of Homes and Homes Around the World. Students compare and contrast the homes in the books to their own homes. Students construct a...
Curated OER
Touch and Discover
Students identify the physical properties of items using the sense of touch. In this touch and discover lesson, students describe items. Students sort items using a Venn diagram.
Curated OER
Clouds
Young scholars explore basic cloud types and the weather associated with each one. In this earth science activity, students participate in numerous activities including going outside to observe the clouds they see, making a cloud in a...
Curated OER
Measuring Snowfall
Students predict the amount of snowfall for the week and measure snowfall. In this measuring snowfall lesson plan, student use a precipitation gauge to measure the week's snowfall; and analyze the data to determine whether or not...
Curated OER
Tulip Graphing
Young scholars create a graph of tulip growth. In this data analysis lesson, students plant tulip bulbs and use graph paper to begin graphing data on the growth of the tulip.
Curated OER
Tally Time
Students create a tally chart. In this math and health lesson, students discuss healthy foods and create a tally chart showing the number of students who like to eat healthy foods.
Curated OER
Plastic Packaging
Students collect data. In this math lesson, students collect data about recyclable materials. Students develop a plan that will help the environment. Recycling plastic containers is discussed.
Curated OER
Leap Frog Experiment
Second graders ask questions and design an experiment to explore different spinners in "The Leap Frog" board game. They conduct their experiment, collect information and interpret the results using a graph.
Curated OER
Party, Party, Party
Second graders conduct investigations with counting, comparing, organizing, analyzing, displaying and interpreting data. They pose questions for investigation and collect the data. Students display the data in tally charts, uniform...
Curated OER
Dynamite Data
Second graders rotate through a variety of stations designed to offer practice in manipulating data. They sort, tally and count items and then create bar graphs, tables, and pie graphs to record their findings.
Curated OER
How Do I Measure Up?
Students measure and record weights and heights and compare to others in the class as they find out more about their bodies.
Curated OER
A Bar of Many Colors
Second graders use colored candies to collect data, construct double bar graphs, and find averages.
Other popular searches
- Data Analysis Pictograph
- Pictograph Worksheet
- Bar Graphs Pictographs
- Pictographs and Bar Graphs
- Tally Charts and Pictographs
- Mystery Picture Graph
- Tally Charts or Pictographs.
- Pictograph Stone Carving
- Making a Pictograph
- Math Lessons Pictograph
- Math Pictographs
- Template of Pictograph


