Curated OER
Do You Like Hamburgers Or Hot Dogs Better?-- Class Bar Graph
In this math worksheet, students collaborate to complete a bar graph. Students are surveyed as to their preference for hot dogs or hamburgers. Results are plotted on a bar graph.
Curated OER
What Kind of Movies Do You Like To Watch?-- Class Bar Graph
In this math worksheet, students collaborate in collecting data and displaying it on a class bar graph. Students indicate which type of movies they like and plot the information on the graph.
Curated OER
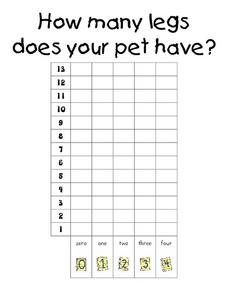
How Many Legs Does Your Pet Have?-- Class Bar Graph
In this math worksheet, learners collaborate as a class to make a bar graph displaying how many legs the students' pets have. Results are plotted on the graph.
Curated OER
If It Were Raining, Would You Rather Play Indoors Or Outside?-- Class Bar Graph
In this math worksheet, students collaborate as a class to complete a bar graph. Students survey classmates as to their preferences in where they like to play. Data is plotted on the bar graph.
Curated OER
How Many Pockets Do You Have Today?--class Bar Graph
In this math worksheet, students complete a class bar graph. Students survey classmates as to how many pockets they have today and plot the data on the graph.
Curated OER
Which of These Animals Have You Ridden Before?-- Class Bar Graph
In this math worksheet, students collaborate to make a bar graph. Students survey classmates as to which animal they have ridden before: elephant, horse, llama, ostrich or camel. Results are plotted on a graph.
Curated OER
How Many Televisions Do You Have in Your Home?-- Bar Graph
In this math worksheet, students participate in a group graphing activity. Students survey classmates as to how many televisions are in each home and plot the results on a bar graph.
Curated OER
How Many Vowels Are in Your Name?-- Class Bar Graph
In this language arts/math worksheet, students collaborate to make a group graph. Students survey classmates about how many vowels are in names. Results are plotted on a bar graph.
Curated OER
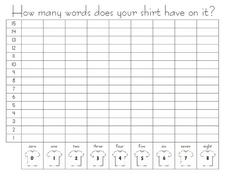
How Many Word Does Your Shirt Have on It? --class Bar Graph
In this math worksheet, students participate in a group bar graph activity. Students survey classmates about how many words, if any, are on their shirts. Results are plotted on a bar graph.
Curated OER
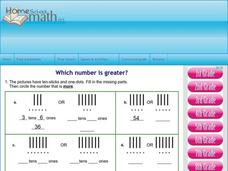
Which Number is Greater?
Students draw pictures of two digit numbers to identify the greater value. In this math lesson, students plot two digit numbers on a number line and identify the greatest or lesser value. Students use the greater than and less than...
Curated OER
Drops on a Penny
Young scientists explore the concept of surface tension at is applies to water. In this activity, learners use a dropper to place drops of water on a penny. Each group guesses how many drops a heads-up penny will hold, then conducts the...
Curated OER
Go The Distance Car Construction
Students build and program a car to drive a specific challenge distance.They must at the end of the lesson, have the car that stops the closest to a challenge distance.
Curated OER
When Ants Fly
Here is a great lesson on constructing line graphs. Learners identify common characteristics of birds, ants common needs of all living things. They also write a story from the perspective of an ant or a bird that has lost its home and...
Curated OER
Relations and Graphs
Here is a simple, yet clever lesson on how to teach the important concepts of greater than, less than, and equal to. Pupils write their names down on grid paper - one letter per box. They compare their names and find a name that is...
Curated OER
Generate Measurement Data Word Problems
Beginning graphers will appreciate this practice with basic bar graphs. For each table of data, there is a corresponding graph for learners to match it to. The five data sets all have the same two factors: days and numbers. Although this...
Curated OER
Give Me A Break!
Students create and conduct a survey. In this broken bones lesson, students discuss if they've ever broken a bone and how a broken bone heals. Students generate questions for a survey on broken bones and healing time, conduct the survey...
Curated OER
Graphing Lesson Plans
By using hands-on graphing lesson plans students can learn how to collect data, and display the information using graphs.
Curated OER
ZIP Code Math
Learners add or subtract to solve ZIP Code Math word problems. A ZIP Code Math work sheet is included. This lesson combines math with geography quite nicely.
Curated OER
The Perfect City
Students analyze group influences on people, events and culture. They design their own perfect society and report it to the class.
Curated OER
Food Pyramid Power: Looking Back and Moving Forward
Students show their knowledge of properties of objects as it pertains to sorting and creating patterns. In this food pyramid power lesson, students show their ability to use whole numbers in different representations by appling...
Curated OER
Tally Time
Students create a tally chart. In this math and health lesson plan, students discuss healthy foods and create a tally chart showing the number of students who like to eat healthy foods.
Curated OER
Plastic Packaging
Students collect data. In this math instructional activity, students collect data about recyclable materials. Students develop a plan that will help the environment. Recycling plastic containers is discussed.
Curated OER
Graphing Favorite Holidays
Students create spreadsheets and bar graphs based on results of survey of favorite holidays.
Curated OER
Algebra: Co-ordinates
Students use Cartesian coordinates. In this graphing instructional activity students use simple formulae, interpret coordinates, and create graphical representations. They express their work algebraically.
Other popular searches
- Line Plots
- Plot Diagram
- Scatter Plots
- Line Plot Worksheets
- Stem and Leaf Plots
- Plot Structure
- Plotting Points on Graph
- Story Plot Diagram
- Elements of Plot
- Plot Development
- Box and Whisker Plots


