Curated OER
RCX Car Line Graph
Students develop a line graph based on distances that an RCX car drives in specified amounts of time. They then are given a specific amount of time for the car to drive and be asked to extrapolate the car's distance from the graph.
Curated OER
Generate Measurement Data Word Problems
Bar and line graphs are an excellent way to visually analyze data: give your scholars practice both analyzing graphs and creating their own! First, they examine five basic bar graphs, indicating the number of squares on specific days....
Curated OER
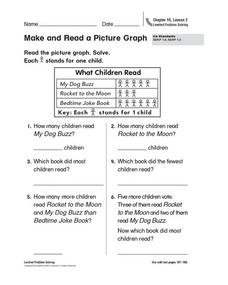
Make and Read a Picture Graph
What books do you like? Have your learners read and interpret a picture graph detailing a fictional class's favorite books. Consider conducting a survey of your learners' favorite books and plotting the results as a class!
Curated OER
Go The Distance Car Construction
Students build and program a car to drive a specific challenge distance.They must at the end of the lesson, have the car that stops the closest to a challenge distance.
Curated OER
Graphing Favorite Holidays
Students create spreadsheets and bar graphs based on results of survey of favorite holidays.
Curated OER
Jelly Belly: What a Wonderful "Bean"!
Young scholars explore how jelly beans are produced. They discuss the origins of the jelly bean and view a video about how jelly beans are prepared, tested, shaped, finished, and shipped and estimate the amount of jelly beans in a jar...
Curated OER
Car Maze competition
Learners use graphs to calibrate an RCX car. They must then program the car to traverse a maze using their calibrations
Curated OER
Tally Time
Students create a tally chart. In this math and health lesson plan, students discuss healthy foods and create a tally chart showing the number of students who like to eat healthy foods.
Curated OER
Food Pyramid Power: Looking Back and Moving Forward
Students show their knowledge of properties of objects as it pertains to sorting and creating patterns. In this food pyramid power lesson, students show their ability to use whole numbers in different representations by appling...
Curated OER
Plastic Packaging
Students collect data. In this math instructional activity, students collect data about recyclable materials. Students develop a plan that will help the environment. Recycling plastic containers is discussed.


