Mathematics Assessment Project
Mean, Median, Mode, and Range
What a find! Here is a instructional activity, designed to meet sixth grade math Common Core standards, that focuses on the calculation of different measures of center for the scores from a penalty shoot-out competition. An independent...
Curated OER
Mean, Median, Mode, and Range
Fifth graders determine the meaning of mean, median, mode, and range. In this measures of central tendency lesson, 5th graders show their ability to find the mean, median, range, and mode of a data set. They use a class set of birthday...
Curated OER
Madley Brath #39 - Stem and Leaf Plots, Mean, Median, Mode and Range
In this measures of central tendency worksheet, students draw a stem and leaf plot of a set of test scores. They compute the mean, median, mode, and range of the data set, and round the answers to the nearest tenth.
Curated OER
Ice Cream
Students explore the concepts of mean, median, mode, and range as they elicit data about people's favorite flavor of ice cream. A practical application of the data obtained offers an extension to the lesson plan.
Curated OER
Mean, Median, Mode and Range
Fourth graders investigate when to find the mean, median, mode and range. In this statistical concepts lesson, 4th graders collect data, make observations and graph the data. Students verify their work on the computer.
Curated OER
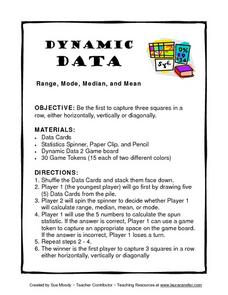
Dynamic Data Range, Mode, Median, and Mean
In this lesson, Dynamic Data Range, Mode, Median, and Mean, students play a game while figuring range, mode, median, and mean. Students spin for their task, figure the mode, mean, median or range of a row of numbers and gain a space on...
Curated OER
Guess-timating Fun
Learners estimate the number of items in a jar and write their estimate boldly on a piece of paper. They line up holding their numbers. Then, they calculate the median, mean, mode and average of the guesses.
Curated OER
Range, Mode, and Median
Fifth and sixth graders sort data from least to greatest and mark an X on the line plot to show how many of each number. Then they determine the range, mode, and median for the problem.
Curated OER
Energy Audit
Students collect data about energy usage and use mathematical calculations to analyze their data. In this energy conservation and statistics math lesson, students survey their homes to complete an energy usage worksheet. Students...
Curated OER
Create Your Own Form
Students gather and organize data using a mock census form, and determine mean, mode, range, and median for sets of data.
Curated OER
What Does Average Look Like?
Fifth graders explore the concepts of range, median, mode, and mean through the use of graphs drawn from models. They use manipulatives to represent data they have collected within their groups, and compare the differences between mode,...
Curated OER
Not Your Average Planet
Fourth graders explore median, mode, mean, and range using information about the planets and our solar system.
Curated OER
Ranging the Triple M's
Fifth graders explore collecting and analyzing data. In this mean, median and mode lesson, 5th graders use real word data to determine the mean, median and mode. Students are given sets of numbers on index cards as asked to find the...
Curated OER
M&Ms; Line Plots and Graphing
Students, using small individual bags of M&Ms, engage in activities including; estimating, sorting, graphing, mean, median, mode, fractions, percentage, and averaging.
Curated OER
Are You My Little Peanut?
Fourth graders explore the mass and length of peanuts by pretending to parent a peanut. In this mode, median and range lesson students graph their measurements and then use them to find the mode, median and range. Students discuss peanut...
Curated OER
Range, Mean, Median, Mode
Young scholars research the impact of craters. In this range, mean, median and mode lesson, students complete an experiment with a marble to simulate the effects of a crater. Young scholars collect and analyze data finding the range,...
Curated OER
One, Two, Three...and They're Off
Students make origami frogs to race. After the race they measure the distance raced, collect the data, enter it into a chart. They then find the mean, median, and mode of the data. Next, students enter this data into Excel at which time...
Curated OER
Drive the Data Derby
Three days of race car design and driving through the classroom while guessing probability could be a third graders dream. Learn to record car speed, distances traveled, and statistics by using calculation ranges using the mean, median,...
Curated OER
Reaction Time
Third graders review important vocabulary to explain measures of central tendency and reaction time. In pairs, they measure reaction time of dropping and catching a ruler. Data is collected after repeated catches and information is...
Laboratory for Atmospheric and Space Physics
Growing Up With A Mission
New Horizons began its journey to Pluto in 2006. Ten years later, it continues its mission. In that time, scholars have surely grown, but how much more will they grow by the time New Horizons reaches its destination? Find out with an...
Curated OER
What's the Fizz Factor
Learners as a class create a fountain using both coke soda, and mentos candy. In this science lesson, students test which combination of coke and mentos products produce the tallest fountain. Learners use the scientific method to track...
Curated OER
Handling Data: measure of Average
Fifth graders analyze data from a simple table. In this graphing lesson, 5th graders compare distributions. Students recognize that the mean helps them find the formula. Students answer questions on the mean, median, and range.
Curated OER
Button Bonanza
Collections of data represented in stem and leaf plots are organized by young statisticians as they embark some math engaging activities.
Curated OER
State Data
Students select ten states and use the number of letters in each state name as their data. In this measures of central tendency lesson, students find the mean, median and mode of the number of letters in their selected state names. They...
Other popular searches
- Range, Mean, Median, Mode
- Range Mean Median Mode
- Mode, Range, Mean, Median
- Range, Median, Mode, Mean


