Curated OER
Graph Picture (Coordinate Pairs)
Coordinate graphing on a grid is the focus of this worksheet. Young mathematicians plot 42 coordinate pairs on a graphing grid, then connect the dots to make a picture. A fun way to get your learners involved in graphing!
Curated OER
Graphing Ordered Pairs
Are you working on graphing ordered pairs in your class? In this worksheet, learners, after looking over and studying how to graph ordered pairs, plot points on a coordinate grid and connect the dots. Class members also identify what...
Curated OER
Petro Products
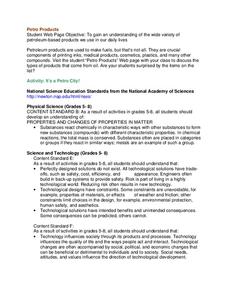
For this petroleum products worksheet, students are given the components of crude oil and they graph the various products found in a 50 gallon barrel. Students complete an activity to determine if they have collected cards that represent...
Curated OER
Reinforcement: Point/Sticker Cards
I love these! Print, cut, and laminate any of these sticker cards to help you manage classroom behavior in a positive way. Tape the blank chart on your learner's desk,or reward him by giving a point or sticker in each of the squares....
Curated OER
Using Grams and Kilograms
Practice the metric system with this basic worksheet. Guided by a fun illustration of a mouse, students problem solve using a balance scale. Two graphic organizers allow them to record their findings in grams and kilograms.
Curated OER
Predictions Survey
Help English learners make predictions using appropriate language through a survey. Each learner will ask a series of questions to 5 different students and then create a short report on their findings. Modifications: Add your own series...
School Mathematics Project
Resource Sheets
This extensive and far-reaching collection of worksheets puts a new twist on many basic concepts. Learners use multiplication to trace a path from one point to another, tile a plane by converting between improper and proper fractions,...
Curated OER
Napier Rods
Napier Rods were created by John Napier, and are used to help with multiplication problems. The chart is very similar to a typical multiplication chart but has a unique history that learners may find interesting.
Curated OER
Energy Worksheet #1
A graph of Earth's average monthly temperatures from 1990 to 1994 is posted across the top of the page for meteorology masters to analyze. Five multiple choice questions are asked regarding temperature variation. This does not have to be...
Curated OER
Graphs to Represent a Data Set
How many animals did Chaplin see at the zoo? Scholars examine three data sets and create a bar graph for each. Encourage them to label the different parts of their graphs, as this is not prompted on the worksheet. Once they finish their...
Curated OER
Measuring Time in Minutes
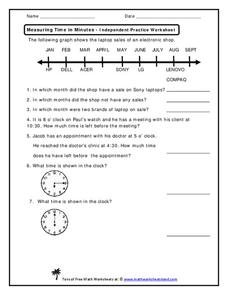
Time is measured in both months and minutes; scholars first examine a line graph to see in which months an electronic shop had sales on specific laptop brands. They answer three questions about the data. Then, they determine how much...
Curated OER
Graphs to Represent a Data Set
By analyzing a word problem about hours worked in a week, scholars get valuable practice with bar graphs and data analysis. They read the scenario, then examine a table of data taken from it. The data includes four days and the...
Curated OER
Graphs that Represent Data Sets
Use these pre-made data sets to introduce kids to bar graphs and data analysis, and then have them take surveys on their own. There are 10 survey scenarios written out here, and scholars synthesize the results of each into a bar graph....
Curated OER
Graphs to Represent a Data Set
Here are a some pre-made sets of data that kids can use to practice data analysis. There are 10 survey scenarios written out, and scholars synthesize the results of each into a bar graph. In addition to the graphing, they answer two...
Curated OER
Generate Measurement Data Word Problems
Plot data for three word problems, each with a table of data. Learners create line plots for these, all of which have only single-digit whole numbers. The large text and few number of problems make this ideal as a whole-class warm up....
Curated OER
Graphs to Represent a Data Set
As your scholars begin to learn how to read graphs, help them pay attention to detail with this matching activity. They read four short data descriptions and match them to one of the four bar graphs pictured. Each graph is labeled along...
Curated OER
Graphs to Represent a Data Set
Here are Jack's hours for the week; scholars organize them into a bar graph in this data analysis worksheet. They write the days along the y-axis and hours along the x-axis. Encourage labeling for this. Consider projecting as an...
Curated OER
Generate Measurement Data Word Problems
Using a set of simple data, learners create a line plot to organize the information. This data includes only single-digit numbers and the highest number is six. Because the answer is explained and illustrated at the bottom, project this...
Curated OER
Generate Measurement Data Word Problems
Beginning graphers will appreciate this practice with basic bar graphs. For each table of data, there is a corresponding graph for learners to match it to. The five data sets all have the same two factors: days and numbers. Although this...
Curated OER
Generate Measurement Data Word Problems
Bar and line graphs are an excellent way to visually analyze data: give your scholars practice both analyzing graphs and creating their own! First, they examine five basic bar graphs, indicating the number of squares on specific days....
Curated OER
Drug Sales Soar - Rate of Change
In this prescription drug worksheet, students answer short answer questions and create graphs on the sales of prescription drugs over a five year span. Students complete six questions.
Curated OER
Flower Comparison Activity
Elementary schoolers write equations for comparisons and make a pictograph based on their comparison. Answers included on page 2.
Curated OER
Graphing Ordered Pairs
Here is graphing activity which has pupils graph ordered pairs and label the axis. They graph five ordered pairs and then interpret the data in the graph.
Curated OER
Challenge: Graphing Functions
Here is a functions activity in which learners solve functions containing variables, graph the coordinates, and answer two questions about it. They complete 14 functions.


