Hi, what do you want to do?
Curated OER
Do You See What I See?
Students hypothesize the role of rocks, soil, and water by observing a terrarium and create a model to explore the water cycle. This is part of a five station set up.
Curated OER
Up, Up, and Away
Young scholars create a model to explore the water cycle. Students also perform different experiments to witness water changing from a liquid to a gas. Young scholars are asked to if they can find ways for water to go away without...
Curated OER
Quickest Round-Up
Students perform activities requested by being timed and observed for compliance. They practice lining up to leave the class in a quiet manner. As they line up, students are observed to ensure good manners. Each class competes against...
Curated OER
Survey Savvy
Third graders design appropriate questions for a survey, survey classmates, create a pictograph to represent the results, and explain the survey results.
Curated OER
Looking at Data
Third graders use two days to create, collect, display and analyze data. Classroom activities and practice build greater understanding to a variety of forms used to display data.
Curated OER
Deer Hunting Pros and Cons
Students research, form an opinion, brainstorm pros and cons and support their own opinion after researching the pros and cons of deer hunting.
Curated OER
Probability or Ability?
Students use their non-dominant hand to catch candy which they tossed in the air. They estimate how many they catch in a second round. They record and determine how the probability changed the second time.
Curated OER
Fish Workings
Learners observe, hypothesize, and draw conclusions regarding fish. They examine their anatomy, and how they function in their environment.
Curated OER
Hermit Crab Races
Students predict the speeds of humans and hermit crabs and investigate their predictions using ratios and formulas. AppleWorks is used for this instructional activity, which includes a data worksheet.
Curated OER
Seeing Life Through An Artist's Eyes
Students examine how art can change the way they look at their lives. After being read a book, they discuss the importance of art in their world and what would happen if it were taken away. They create a watercolor painting and shares...
Curated OER
Relating Number of Insect Species to Water Quality
Students are asked to respond to questions such as:" Have there been surveys of the area to inventory the species?" (For example, for a wetland area, do they know what amphibians live there and how abundant they are?) Are there any...
Curated OER
Mother May I?
Third graders measure distance using nonstandard units of measure. In this measurement lesson, 3rd graders measure a given distance through the use of the game "Mother May I?" Student gather and compare data on how many "giant steps" and...
Curated OER
How Unique Are You?
Students explore how genetic information is passed down from parent to offspring. Because of this, they examine how this causes the variation in each species.
Curated OER
Using mean, median, and mode
For this mean, median, and mode activity, learners read how to use each method and then complete problems using each one. Students complete 8 problems.
Curated OER
A Bird's Eye View of our 50 States
Third graders focus on state birds as they learned absolute location (latitude/longitude) of each state, as well as their relative location (bordering states).
Curated OER
Thank You... Thomas Edison!
Learners investigate the life of Thomas Edison. They research how he made a difference. They understand that accurate data collection is important for math. They create a chart using spreadsheet data.
Curated OER
On the Road Again": Moving People, Products, and Ideas
In this lesson students learn how to identify modes of transportation and communication for moving people, products, and ideas from place to place. Students also study the advantages and disadvantages of different modes of...
Curated OER
Weather Or Not
Students use the internet to find pen pals to share in their weather experiment. Individually, they research the high and low temperatures for cities within the United States and email the results to their pen pal. They also develop a...
Shodor Education Foundation
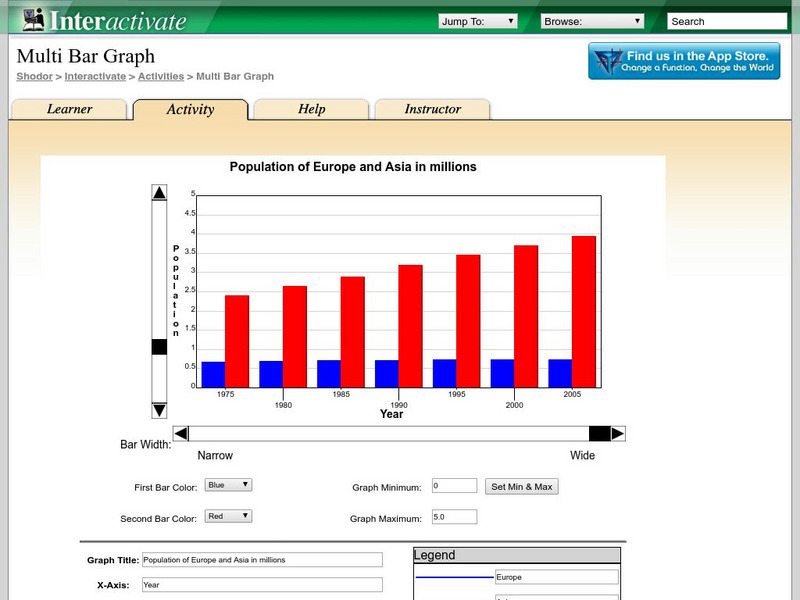
Shodor Interactivate: Multi Bar Graph
The interactive learning activity allows students to manipulate a double bar graph. Teacher resources are included.
Khan Academy
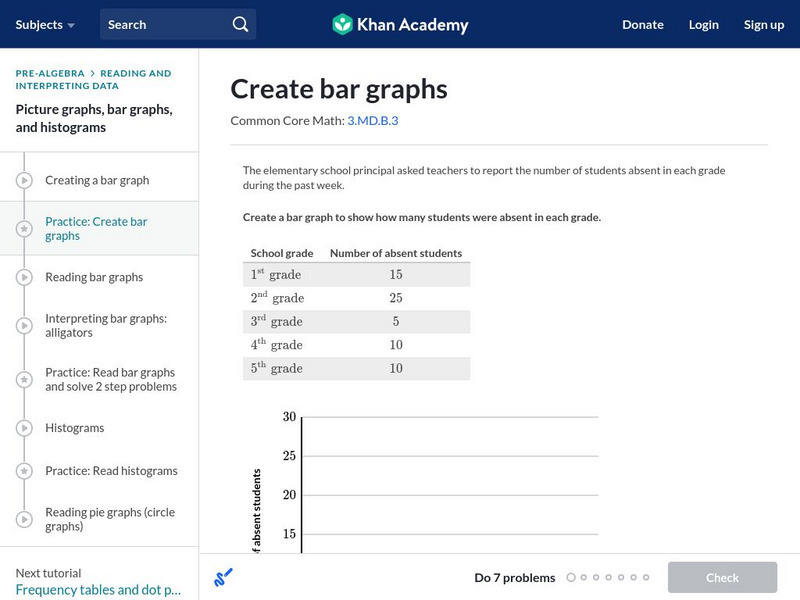
Khan Academy: Create Bar Graphs
Create a bar graph with the data given. Students receive immediate feedback and have the opportunity to try questions repeatedly, watch a video tutorial, or receive hints about creating bar graphs. CCSS.Math.Content.3.MD.B.3 Draw a...
Khan Academy
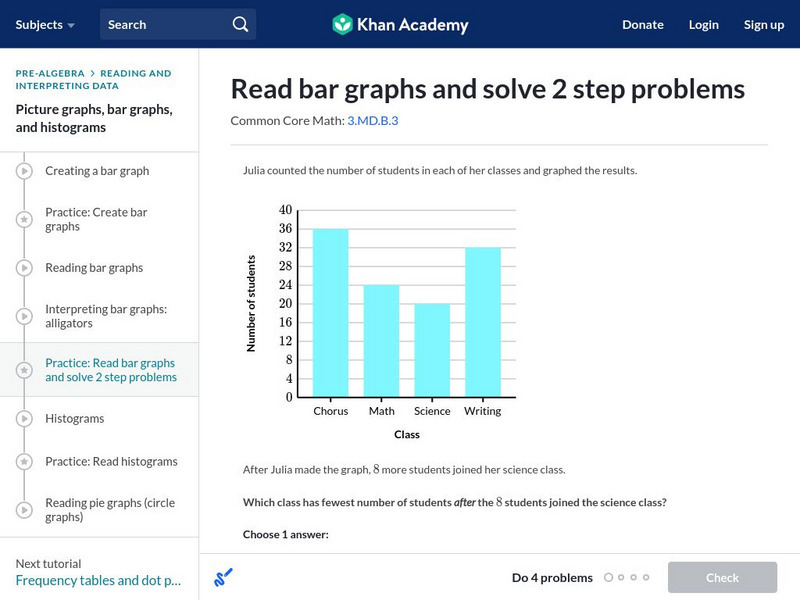
Khan Academy: Read Bar Graphs and Solve 2 Step Problems
Read and interpret a double bar graphs. Students receive immediate feedback and have the opportunity to try questions repeatedly, watch a video or receive hints. CCSS.Math.Content.3.MD.B.3 Draw a scaled picture graph and a scaled bar...
Khan Academy
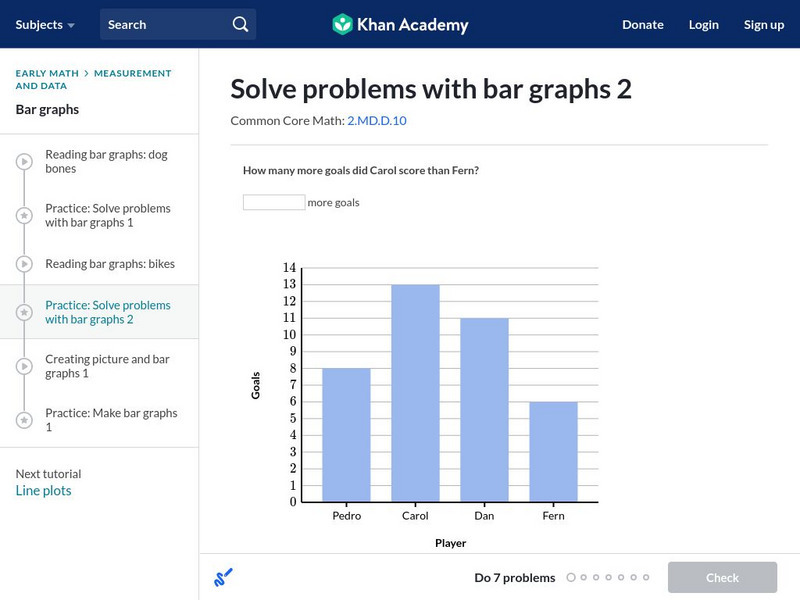
Khan Academy: Solve Problems With Bar Graphs 2
Use bar graphs to solve addition and subtraction word problems. Students receive immediate feedback and have the opportunity to try questions repeatedly, watch a tutorial video, or receive hints.
Khan Academy
Khan Academy: Solving Problems With Bar Graphs 2
In this exercise, students practice solving problems with bar graphs. Students receive immediate feedback and have the opportunity to get hints, watch a tutorial video, and try questions repeatedly.
Khan Academy
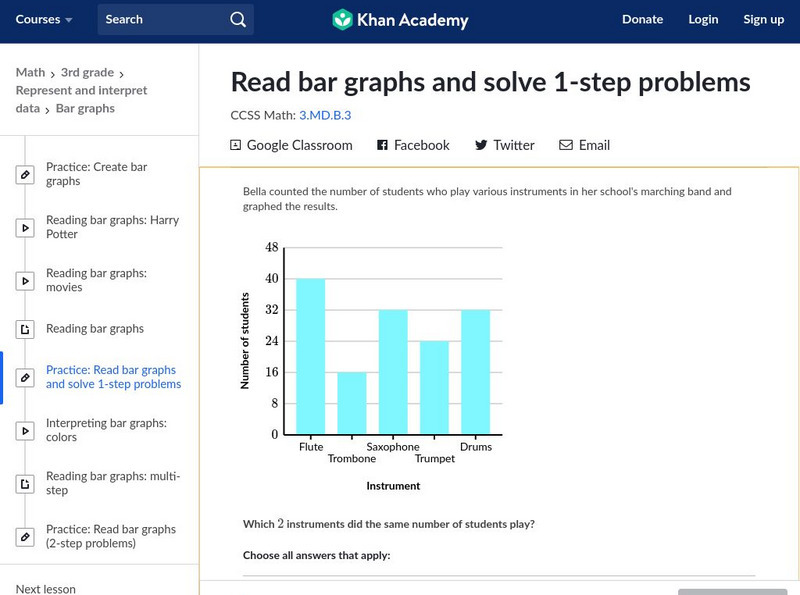
Khan Academy: Read Bar Graphs and Solve 1 Step Problems
Interpret bar graphs to answer questions about a context. Students receive immediate feedback and have the opportunity to try questions repeatedly, watch a video or receive hints.
Other popular searches
- Skittles Bar Graph
- Double Bar Graphs
- Bar Graphs Pictographs
- Histogram and Bar Graph
- Bar Graphs and Histograms
- Bar Graph Problem Solving
- Favorite Food Bar Graph
- Bar Graphs Histograms
- Interpreting Bar Graphs
- Bar Graphs for Birthdays
- Bar Graph Worksheet
- Bar Graphs and Charts


