US Department of Commerce
Featured Activity: Population Change Over Time
Keep track of a state's population. After a brief discussion on how population data is used for funding, individuals look at population changes over time. Pupils find the population of two states using three different censuses. They then...
Mixing In Math
Mixing in Math: Growing Plants
Whether you have your class plant seeds or begin when sprouts are visible, math skills are used here to predict and track growth over time. Straw bar graphs show plant height on a given day while the graph as a whole shows changes over...
Voice of America
Henry Ford, 1863-1947: He Revolutionized the Auto Industry
How did Henry Ford change the world? One word: automobile. After reading a two-page passage about Henry Ford's contributions to society with the invention of the automobile, readers respond to a series of 10 reading comprehension...
US Department of Commerce
Immigration Nation
People come and people go. Given tabular census data on the annual number of immigrants from four different regions of the world between 2000 and 2010, pupils create double bar graphs and line graphs from the data. They analyze their...
Curated OER
Paper Production
Students compare paper making by hand and by assembly line. In this manufacturing lesson, students compare and contrast the two main ways to make paper, by hand or by machine. Students research paper making and have a class...
Curated OER
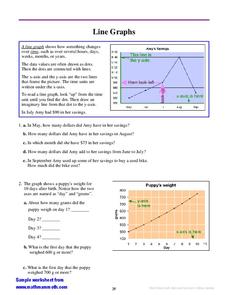
Line Graphs
In this interpreting line graphs worksheet, learners read an explanation and observe an example of a line graph and its parts and then answer questions interpreting two line graphs. Students write eleven answers.
Space Awareness
Making A Sundial
Can people really measure time just by using the sun? Scholars venture outside on a nice, sunny day to build sundials and learn how people measured time 600 years ago. The class builds two different sundials while gaining practice with...
Curated OER
How Do Plants Grow?
Young scholars investigate plant growth. In this plant growth lesson, students investigate what would happen to plants if they did not have water and sunlight. Young scholars conduct experiments to determine what plants need. Students...
Curated OER
Line 'Em Up!
Young scholars find coordinate points on a grid and create a line graph with those points. This lesson should ideally be used during a unit on various types of graphs. They make and use coordinate systems to specify locations and to...
Wild BC
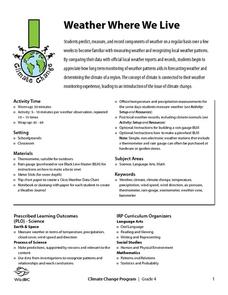
Weather Where We Live
Over a span of two weeks or more, mini meteorologists record weather-related measurements. What makes this particular resource different from others covering similar activities are the thorough details for the teacher and printables for...
Curated OER
Cool Times with Heat
Students work with thermometers to complete problems about temperature. They investigate cooling patterns, how location affects temperature, and what happens when water having different temperature is mixed. They measure temperature in...
Curated OER
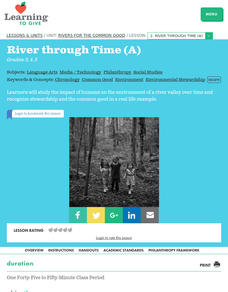
River through Time (A)
Students study the impact of humans on the environment of a river valley over time and recognize stewardship and the common good in a real life example.
North Carolina Museum of Natural Sciences
Weather Watch Activity Guide: Groundhog Day
Exactly what do groundhogs know about weather? Not as much as your science students will after completing these lessons and activities that cover everything from the earth's rotation and the creation of shadows, to cloud...
Curated OER
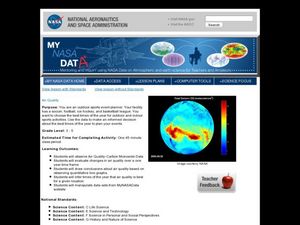
Air Quality
Students observe air quality and monoxide data. In this air quality lesson plan, students draw conclusions and manipulate data from a one year period on changes in air quality.
Curated OER
Solid Waste and Recycling
Students demonstrate effects of waste on environment and ways of reducing it, observe how much packaging goes into bag lunches each day, and survey their families to assess awareness levels and household recycling practices. Lessons all...
Curated OER
American Inventors
In this inventors on-line worksheet, students read short passages about the nineteenth century American inventors Thomas Edison, Benjamin Franklin, and Alexander Graham Bell. They answer 5 fill in the blank and answer 5 multiple choice...
Curated OER
Graphing Lesson Plans
By using hands-on graphing lesson plans students can learn how to collect data, and display the information using graphs.
Curated OER
Human Effect
Students investigate changes in air quality. In this science instructional activity, students compare data to determine the air quality. Students explore how humans affect the air quality.
Curated OER
The Best Friend of Charleston, The Charleston Railroad
Third graders explore the Charleston Railroad. In this South Carolina history lesson, 3rd graders examine the impact of the rail line on economy and citizens of the state. Students create posters to advertising...
Curated OER
Cosmic PE Bowling
Students explore fitness through participation in a lifetime activity. They are shown the mechanics, scoring, etc for bowling. Students recieve PE twice a week during this time. They have what is called "Cosmic Bowling in PE" during...
Curated OER
How We Get From Here to There
Students recognize various types of movement people rely on to get from one place to another, locate the forms of movement on a map and choose one form of movement and research its path.
Curated OER
Seasonal cycles
Young scholars understand that the rotation of the Earth is responsible for the seasons. In this seasonal cycles instructional activity, students learn how the rotation of the Earth affects the seasons. Young scholars answer questions...
Curated OER
Heat Energy
Students study how matter changes from solids to liquids or liquids to solids. In this physical science lesson, students discuss heat energy and experiment with heat by changing a candle into a liquid using a hot plate.
Curated OER
Toboggan Science
Students conduct toboggan time trials to investigate the variables that have the greatest effect on toboggan speed. In small groups, they develop a hypothesis to test and perform three trials on the toboggan run for each variable.


