Hi, what do you want to do?
Curated OER
Habitats: Rainforest
Young scholars use the internet to find reasons the rainforest is endangered and ways that affects the rest of the world. They read for information, perform experiments, locate rainforests on maps, and write about this ecosystem.
Curated OER
CREATE A FISH
Students watch a video that helps shows them how a diagram, flow chart, or blueprint can help them create a 3-d fish with the correct anatomy to live in a realistic environment.
Curated OER
Instructional Software Resources for Grades K-3
Students become familiar with teh selection, evaluation, and use of instructional software for 4-8 classroom. They download software demos from the web and discuss critiquing software. Students browse software evaluations on web sites.
Curated OER
VAcations in Northern California
Students explore the natural resources and National Parks of Northern California that are commonly visited by people traveling in the United States. They use maps to locate various sites, plan a highway travel route and use the internet...
Curated OER
A Bird's Eye View of our 50 States
Third graders focus on state birds as they learned absolute location (latitude/longitude) of each state, as well as their relative location (bordering states).
Curated OER
How to Beat the Rainy Day Blues
With a little ingenuity, lively exercise can occur despite the weather.
The Math League
The Math League: Using Data and Statistics: Pie Charts
This introductory tutorial about statistical graphing with four examples of how pie charts (circle graphs) are constructed and read.
Math Is Fun
Math Is Fun: Data Graphs
Create and customize a bar graph, line graph, or pie chart based on a set of data and print it out.
E-learning for Kids
E Learning for Kids: Math: Tea Store: Reading a Table
Students will demonstrate how to interpret information in a table.
The Math League
The Math League: Ratio and Proportion
This tutorial provides definitions and examples of ratios and proportions and features comparing ratios and converting rates.
Primary Resources
Primary Resources: Line Graphs and Pie Charts
Here are a few resources to use with your students when teaching about line graphs or pie charts.
Scholastic
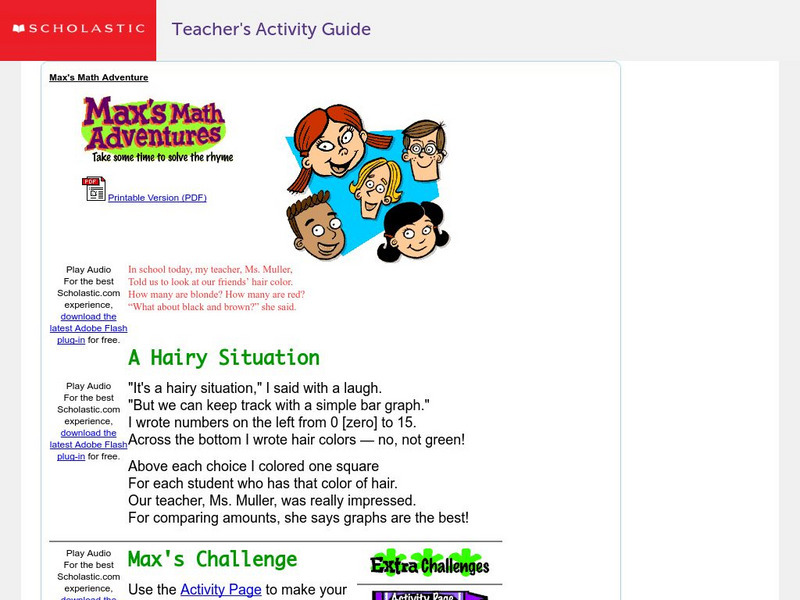
Scholastic: Max's Math Adventures: A Hairy Situation
Help Max make a bar graph to show the hair colors of his classmates. Teachers will appreciate the activities with bar graphs in the extra challenges. Use the teacher's guide to create a fun and engaging lesson.
PBS
Pbs: Mathline Creature Feature Lesson Plan [Pdf]
An interdisciplinary math, science, and language arts lesson that engages students in an exploration of statistics. Through a study of various forest climates, students utilize data collection and analysis, classification, and graphing....
Math Is Fun
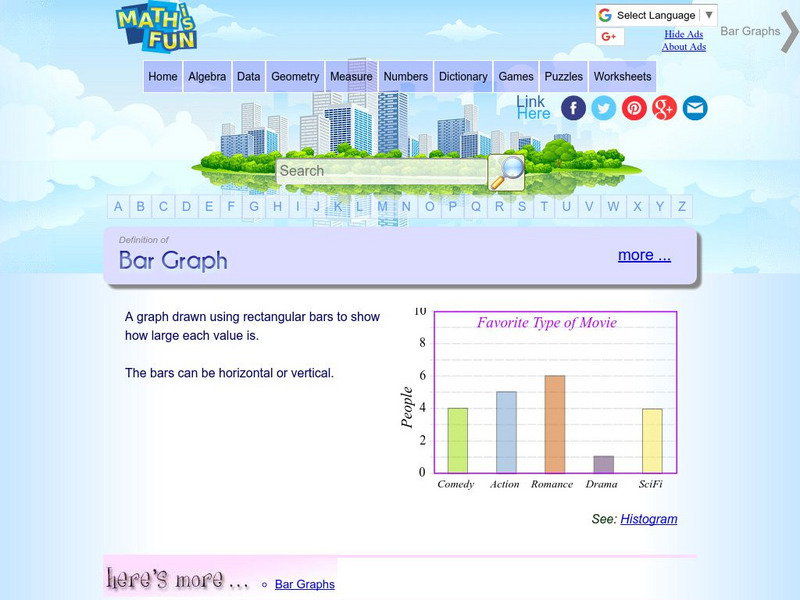
Math Is Fun: Definition of Bar Graph
Get the definition for a bar graph. Then, select the link "here's more" and use the interactive graph to display data as a bar graph, line graph or pie chart. The finished graph may be printed.
The Math League
The Math League: Using Data and Statistics
This site contains two short examples of line graphs, charts that show change over time. This is a quick introduction to the topic of statistical graphing.
University of Cambridge
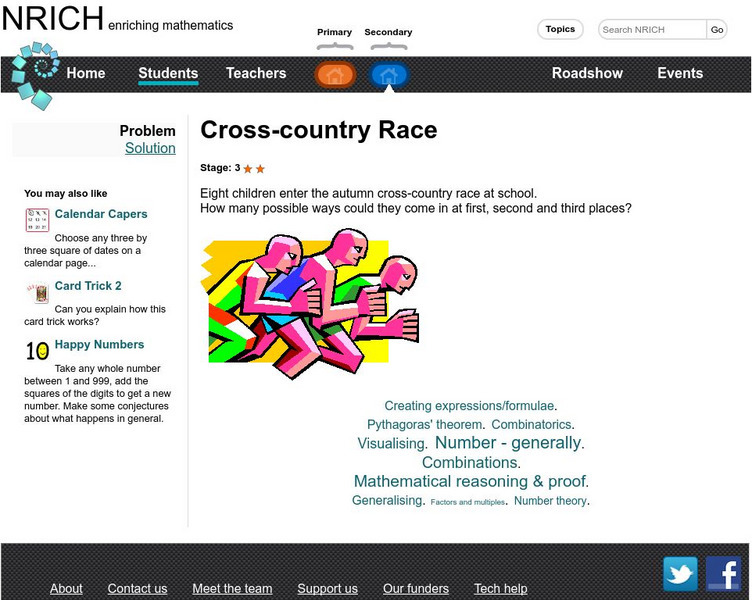
University of Cambridge: Nrich: Cross Country Race
On this one page website sharpen your logic and problem solving skills while working on this challenge. The solution is available to double check your solution.
Alabama Learning Exchange
Alex: Ice Cream Sundae Survey
Learners quickly realize the importance of learning how to read and find information in charts, graphs, and tables compared to finding the same information written in a paragraph. This is a fun, high energy lesson!This lesson plan was...
Science Education Resource Center at Carleton College
Serc: Inquiry: How Herbs Change Based on Growing Conditions
In this activity, students will develop writing, math, and inquiry skills by investigating the taste of basil. Students will test basil in different growing conditions while also comparing it to a controlled variable. Students will then...
PBS
Pbs Kids Afterschool Adventure!: Operation: Martha's Stem Stories Activity Plan
Welcome to Martha's STEM Stories! STEM stands for science, technology, engineering, and mathematics. You may already know that doing STEM means testing ideas, collecting data, making calculations, and drawing graphs and charts-but you...


![Pbs: Mathline Creature Feature Lesson Plan [Pdf] Lesson Plan Pbs: Mathline Creature Feature Lesson Plan [Pdf] Lesson Plan](https://static.lp.lexp.cloud/images/attachment_defaults/resource/large/FPO-knovation.png)


