Curated OER
BBC Bird Pictogram- Math Worksheet
In this British math learning exercise, students develop a pictogram based on the information that is given about what certain types of birds like to eat. They see pictures of the birds and their food preferences before completing the...
Curated OER
Pictograms of Haircuts
In this math worksheet, students convert the data into numbers from the pictograms. The graphic organizer gives information for the 8 follow up questions.
Curated OER
M&M Graphing and Probability
Students sort, classify, and graph M & M's. They create pictographs and bar graphs with the colors and numbers in each bag of M & M's. They calculate the ratio and probability based on class results.
Curated OER
Probability Using M&M's
Students estimate and then count the number of each color of M&M's in their bag. In this mathematics lesson, students find the experimental probability of selecting each color from the bag. Students create pictographs and bar graphs...
Curated OER
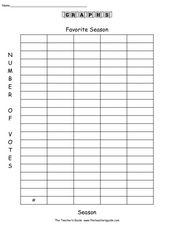
Favorite Season
In this graphing worksheet, learners conduct a survey of people's favorite survey. They then complete 8 questions about the data gathered before creating a bar graph and pictograph on templates.
Curated OER
Introduction to Graphs
Learners poll classmates to gather information for a graph. They identify three types of graphs (bar, line, table). Students create each type of graph using data gathered from classmates.
Curated OER
Picture Graphs
Are your youngsters learning how to read picture graphs? Use these five examples to asess your learners' comprehension. Consider rearranging them differently; the presentation is slightly congested.
Curated OER
Creating Graphs
This graphing PowerPoint demonstrates how to use graphs to gather information. The slides contain examples of graphs and display the data clearly. This presentation also gives clear directions on how to construct various graphs by using...
Curated OER
Mmm, Mmm, M&M's
Here is another version of the classic M&M math lesson. In this one, upper graders utilize the ClarisWorks Spreadsheet program in order to document the data they come up with from their bags of M&M's. After making their initial...
Curated OER
M&M Graphing and Probability
Students create a variety of graphs. They count, sort, and classify M&M's by color and record data on a chart. They use data from the chart to create pictographs, bar graphs and circle graphs. They analyze data and determine...
Alabama Learning Exchange
Inch by Inch
Third graders listen to a read-aloud of Leo Lionni's, Inch by Inch before measuring a variety of items using both standard and metric units. They record the measurement data and follow a recipe for dirt pie.
Curated OER
Where Do I Fit on the Graph?
Young scholars collect data and create graphs about themselves, their community, and the world around them. They use a variety of methods to organize data, such as stickers, clothespins, name tags, coloring, tally marks, etc.
Curated OER
Numeracy Practice Math Sports
In this math worksheet, students match the pictographs to find the quantities and write each number sentence. They use the operation of addition.
Alabama Learning Exchange
What do Plants Need?
Students plant seeds and watch them sprout. Once growing plants are placed in different conditions and students record data about their growth. They graph the data.
Curated OER
Weather Observation Journal
Students record weather for a period of one month. In this weather lesson, students observe weather for one month on a large pictograph. Students record clouds, wind, temperature and any other weather conditions they observe. Students...
Curated OER
Can You Measure Up?
Here is a well-designed lesson on common standards of measurement for your young mathematicians. In it, learners calculate measurements in standard and non-standard units. They make predictions, record data, and construct and design...
Curated OER
Math Made Easy
Learners evaluate word problems. In this problem solving lesson, students are presented with word problems requiring graphing skills and learners work independently to solve.
Curated OER
Pictogram 1 and 2
In this mathematical worksheet, young scholars experience problem solving two pictograms dealing with favorite animals and rainy days.
Curated OER
Tulip Graphing
Students create a graph of tulip growth. In this data analysis lesson, students plant tulip bulbs and use graph paper to begin graphing data on the growth of the tulip.
Curated OER
Measuring Snowfall
Students predict the amount of snowfall for the week and measure snowfall. In this measuring snowfall lesson, student use a precipitation gauge to measure the week's snowfall; and analyze the data to determine whether or not...
Curated OER
Probability With a Random Drawing
Students define probability, and predict, record, and discuss outcomes from a random drawing, then identify most likely and least likely outcomes. They conduct a random drawing, record the data on a data chart, analyze the data, and...
Curated OER
Graphing Fun In Third Grade
Third graders display information in a graph, table, and chart. In this data lesson plan, 3rd graders look at graphs, tables, and charts, discuss their importance, and make their own.
Curated OER
Weather Report Chart
Students complete a weather report chart after studying weather patterns for a period of time. In this weather report instructional activity, students measure temperature, precipitation, cloud cover, wind speed, and wind direction for a...
Curated OER
I'm a Weather Watcher Watching plants grow by......my,my,my
Students investigate how weather affects how plants grow. They collect data on weather and plant growth for a week and display the data on a graph. For a culminating experience they design a movie using software that shows plant growth...


