Curated OER
Pies and Percentages--Learning About Pie Graphs
In this pie graph worksheet, students draw a pie graph for the zookeeper with the data he collected, choose a different color for each animal species and make a key to the graph.
Curated OER
Using Graphs and Charts
Students complete T charts and manipulate numbers using graphs and charts. In this math graphs and charts lesson plan, students review the concepts of pattern and function. Students then complete practice pages where they manipulate...
Curated OER
Charting and Graphing Sales
Students analyze graphs, charts and tables. For this data analysis lesson, students practice creating and analyzing charts, graphs and tables corresponding to sales and surveys. This lesson uses data relevant to students and includes...
Curated OER
Usage and Interpretation of Graphs
Cooperative groups are formed for this graphing activity. Each group must construct a graph that represents how many eyelets (the holes for laces in shoes), are present in their group. A whole-class bar graph is eventually constructed...
Curated OER
Paws in Jobland: Lesson Plan 35 - Catch of the Day
Students study information for fish farm workers given in the form of a chart, in order to practice interpreting data while learning about the career of a fisherman. In this data interpretation lesson, students read the chart to find out...
Curated OER
Graphing Favorite Fruit
Third graders take poll and sort data, enter the data to create a spreadsheet and create bar and pie graphs.
Curated OER
Use Google Maps to Teach Math
Capture the engagement of young mathematicians with this upper-elementary math lesson on measuring time and distance. Using Google Maps, students first measure and compare the distance and time it takes to travel between different...
Curated OER
Getting There
Students practice reading a pictograph. In this data analysis lesson plan, students collect data and create their own pictograph. A students worksheet is included.
Curated OER
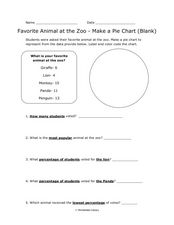
Pie Chart: Favorite Animal at the Zoo
In these three interpreting a pie chart and answering questions worksheets, students use the data provided to label and color code the blank and outlined pie charts, read and interpret a completed pie chart, and then answer questions...
Curated OER
Graphing Fun In Third Grade
Third graders display information in a graph, table, and chart. In this data lesson plan, 3rd graders look at graphs, tables, and charts, discuss their importance, and make their own.
Curated OER
Activity: An Experiment with Dice
Roll the dice with this activity and teach young mathematicians about probability. Record outcomes for rolling two number cubes in order to determine what is most likely to happen. Graph the data and investigate patterns in the results,...
Curated OER
Graphing
Students collect data to create different types of graphs-line, pie, and bar graphs. They use StarOffice 6.0 to create graphs.
Curated OER
Special Ed. Resource
Ways to organize data is the focus of this math PowerPoint. Students view slides that define and give descriptions of a variety of graphs, and how mean, median, and mode are found. A good visual tool which should benefit almost all types...
Curated OER
Surname Survey
Learners use data from the U.S. Census Bureau to determine whether last names in a local phone directory reflect the Census Bureau's list of the most common surnames in the country. In this surnames lesson plan, students use the Internet...
Curated OER
Pizza! Pizza!
Third graders tally, sort, and organize pizza orders from monthly school sales. They create an advertising campaign to promote the School Pizza Sale, record the data in graph form, compare and contrast the tallies throughout the year,...
Curated OER
M&M Graphing and Probability
Young scholars sort, classify, and graph M & M's. They create pictographs and bar graphs with the colors and numbers in each bag of M & M's. They calculate the ratio and probability based on class results.
Curated OER
Using Excel To Teach Probability And Graphing
Students engage in the use of technology to investigate the mathematical concepts of probability and graphing. They use the skills of predicting an outcome to come up with reasonable possibilities. Students also practice using a...
Curated OER
Favorite Animal at the Zoo - Making a Pie Chart
In this graphing and interpretation worksheet set, students draw charts that are either blank or outlined that show information about students' favorite zoo animals. They answer questions based on the data in 15 examples.
Curated OER
And You Thought Gasoline Was Expensive!
Students carry out a cost analysis. In this comparative math lesson, students compare the cost of equal measures of gasoline to mouthwash, house paint, fruit juice, white-out, and other liquids.
Education World
The African American Population in US History
How has the African American population changed over the years? Learners use charts, statistical data, and maps to see how populations in African American communities have changed since the 1860s. Activity modifications are included to...
Curated OER
Graphing With Candy
Students gather information and interpret the results using a tally chart, a table, and a bar graph.
Curated OER
Coin Count & Classification
Students make a prediction about how 100 pennies sort by decade or year and then test their predictions. They organize their data using a graph that is imbedded in this lesson.
Curated OER
My Test Book: Reading Graphs
In this online interactive math skills worksheet, learners solve 10 multiple choice math problems that require them to read and interpret graphs. Students may view the correct answers.
Curated OER
Graphs Abound
Students create a survey for their classmates to collect data on their favorite foods, eye color, pets or other categorical data. They compile the data from the survey in a table and then make a bar graph of each category using a web tool.


